INTRODUCTION
Various outcrop studies have interpreted deep-water strata as highly organised (e.g. Abreu et al., 2003; Flint et al., 2011; Gardner et al., 2003; Gervais et al., 2006; Prélat et al., 2009). This prompted introduction of a series of hierarchical classification schemes for channel fill (e.g. Abreu et al., 2003; Gardner et al., 2003; Sprague et al., 2005) and lobe strata (e.g. Gervais et al., 2006; Grundvåg et al., 2014; Mulder & Etienne, 2010; Prélat et al., 2009; Straub & Pyles, 2012). Interpretations of order suggest that there are associated and organized controlling factors that lead to the documented depositional patterns. Most commonly, interpretations of ordered strata and cyclicity are attributed to allogenic changes such as sea-level fluctuations, tectonic pulses, and climate cycles (e.g., Blum et al., 2018; Johnson et al., 2001; Sweet et al., 2020; Zhang et al., 2018) or, less commonly but significantly, to autogenic processes of avulsion and lobe switching, which have mostly been highlighted in numerical and analogue modelling studies (e.g. Burgess et al., 2019; Hamilton et al., 2015; Straub & Pyles, 2012). However, several authors have pointed out that distinguishing between allogenic and autogenic forcing is not straightforward (Bauer et al., 2020; Burgess et al., 2019; Hou et al., 2022). Recently, Grime et al. (2024) have suggested that different levels of lobe hierarchy are affected differently by autogenic and allogenic processes. They propose that the evolution of sediment delivery is the main external process affecting the lobe complex level and drives lobe complex progradation and retrogradation patterns. This broadly conforms with ideas employed by sequence stratigraphic approaches even though they attribute most other recorded patterns to autogenic processes. Ferguson et al. (2020) proposed from results of flume experiments that different depositional environments (channel-levee vs lobes) are influenced by allogenic and autogenic processes in different degrees. However, qualitative observations and interpretations alone, without supporting quantitative analysis, are only ever very weak evidence for order in strata (Wilkinson et al., 2003; Burgess, 2016, Hou et al., 2022), especially in so-called high-frequency successions, and are often just a form of implicit modelling where subjective assumptions determine the results more than data (e.g. Hadler-Jacobsen et al., 2007; Johnson et al., 2001; Kassi et al., 2011; Sixsmith et al., 2004).
Here, we adopt a more data-driven approach, applying quantitative analysis of bed-scale logs to test for evidence of order and bed cyclicity, as predicted by sequence stratigraphic models, in a dataset collected from Unit A of the Permian Laingsburg Formation deposited in the Karoo Basin, South Africa. We use two different methods, i.e. runs test and markov chain analysis, to determine if bed thickness and vertical facies successions show evidence for order, as previously described in Burgess (2016) and Burgess et al. (2019), and both included in StrataWorkbench, a Matlab code for the analysis of order and disorder in vertical stratigraphic sections available to download as open-source code from https://github.com/Burgesski/StrataWorkBench (Please refer to the supplemental material for the employed workflow). We chose to employ StrataWorkbench instead of astronomical cycle focussed cyclostratigraphic analytical techniques because the Karoo lacks the chronostratigraphic data to consider such a technique anything than overinterpretation. We compare our findings with the extensive previous sequence stratigraphic work carried out in the Laingsburg depocenter (Brunt et al., 2013; Flint et al., 2011; Hodgson et al., 2011; Morris et al., 2014; van der Merwe et al., 2014) particularly the interpretation of multi-scale architecture of the basin-floor fan, lobe complexes, lobes and beds on Fan A of the Laingsburg Formation (Sixsmith et al., 2004; Spychala, Hodgson, & Lee, 2017; Spychala, Hodgson, Prélat, et al., 2017).
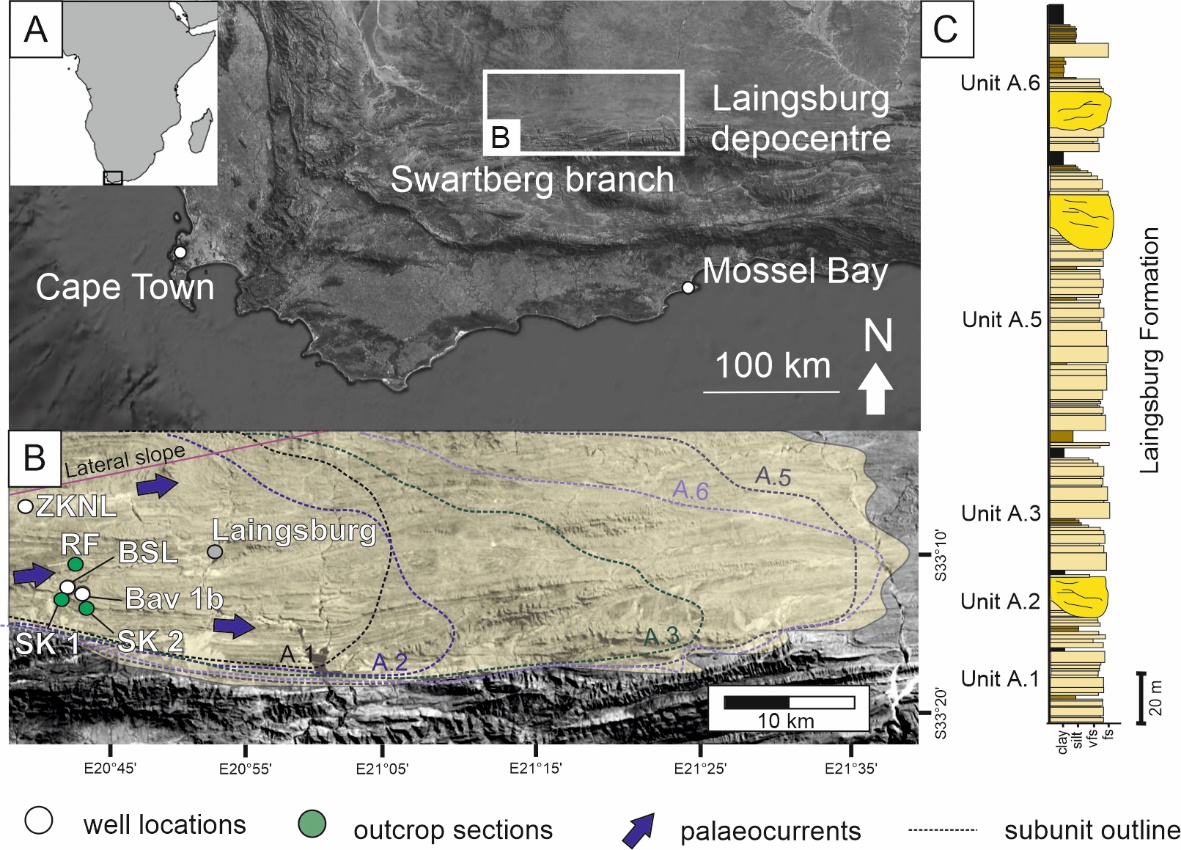
THE LAINGSBURG FORMATION, KAROO BASIN
The Karoo Basin is interpreted to represent either a retro-arc foreland basin to a magmatic arc and fold-thrust belt (Catuneanu et al., 1998; Visser, 1997; Visser & Prackelt, 1996), or to be driven by dynamic topography associated with mantle flow processes coupled with distant subduction of the palaeo-Pacific plate (Pysklywec & Mitrovica, 1999) in its early development phase. The Laingsburg Formation is part of the Ecca Group and consists of Unit A basin floor fan strata (Prélat & Hodgson, 2013; Sixsmith et al., 2004; Spychala, Hodgson, & Lee, 2017; Spychala, Hodgson, Prélat, et al., 2017) and Unit B base of slope strata (Brunt et al., 2013; Grecula et al., 2003). Unit A is interpreted as a basin-floor fan system composed of tabular sandstone-rich units interpreted as lobes that are locally cut by sandstone-rich channel-fills (Sixsmith et al., 2004). The sand-rich units (30 to 110 m thick) are laterally extensive (kilometres) and are intercalated with thin-bedded siltstone units that are interpreted as distal lobe complex intervals (Spychala, Hodgson, Prélat, et al., 2017). In detail analysis of cross strike changes strongly suggest a lateral slope confining the system to the North (Spychala, Hodgson, Prélat, et al., 2017). Areas that are affected by the lateral slope can include slumped intervals in their succession. Sixsmith et al. (2004) originally subdivided Unit A into seven sand-stone prone units A.1 to A.7. This subdivision was later re-interpreted by Prélat and Hodgson (2013) to only 5 subdivisions A.1, A.2, A.3, A.5 and A.6, while A.4 and A.7 were re-interpreted as lobe complexes within A.5 and A.6. Flint et al. (2011) assessed the sequence stratigraphy of Unit A, dividing the unit into three composite sequences (CS) composed of A.1 to A.3 with a progradational stacking pattern, A.5 recording the most basinward advance, and A.6 showing a retrogradational stacking pattern. These three composite sequences make up the Unit A composite sequence set (Flint et al., 2011). Chronostratigraphic data suggest that the entirety of Unit A was deposited in less than 20 My (Fildani et al., 2007). While there is no indication of the timespan in which CS 1 was deposited, the deposition of CS 2 and CS 3 roughly took between 3 and 4 My (Fildani et al., 2007). Lithologically, Unit A of the Laingsburg Formation consist of well-sorted fine-to-very-fine sandstone and siltstone turbidites, hybrid beds, debrites and mass-wasting intervals.
DATASET AND DEFINTIONS
The sections of Unit A used in this study are located in the proximal part of the system (Fig. 1B) and include outcrop sections (SK-1, SK-2, RF, ZKNL) as well as borehole logs (BSL, BAV-1). The selection of sections from the proximal area bases itself on the outcomes of Burgess et al. (2019) who show that suggests that if an allogenic signal is present it is most likely verifiable preserved in the proximal area of the fan system. Section ZKNL which shows heavy influence from the lateral slope was included to assess the effect of the mass wasting on order and bed thickness trends.

A bed is defined is defined as an event bed as the study addresses sediment gravity flows. This includes hybrid event beds as well as remobilization events, regardless of their grain size. When possible, amalgamated beds were separated from each other and thick fine-grained intervals devided into their respective thin-beds. Latter was more successful in core datasets and harder to achieve in outcrop sections where fine-grained are commonly less well preserved or even covered with soil. The effect on the data interpretation is discussed in the section (The problem of thin-bed exposure).
Order is hereby defined as the arrangement of facies and bed thickness in sequences suggested by sequence stratigraphic models (e.g. thickening upward successions going from fine grained to coarse grained structureless deposits).
MARKOV ANALYSIS AND RUNS TESTS
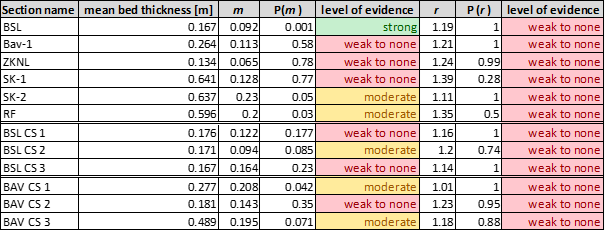
Markov chain and runs test analysis have been performed on logged section data to assess if the strata show evidence for stacking trends and cyclicity, both specific types of order where order is a pattern or structure present in the strata that is unlikely to occur by chance and therefore likely to be caused by some specific allo- or autogenic process. The methods first calculate two metrics to characterize any structure and pattern present in the strata, a Markov chain metric m calculated from the facies succession, and a runs test metric r calculated from the bed thicknesses succession (Burgess, 2016) Calculating p-values then determines how likely each metric value is to occur by chance in randomly shuffled versions of the same succession. Because there are many more disordered than ordered permutations, this provides a robust test for significant structure and pattern in the strata which we can confidently describe as order. p values are calculated by comparing the values of m and r from observed strata with distributions of m and r values calculated from 5000 randomly shuffled realizations of the same set of beds. Rather than apply arbitrary significance level cutoffs, we prefer to assess the p values in terms of the general level of evidence they indicate for ordered strata. p values less than 0.01, for example, suggest substantial levels of order are present because this value indicates a low probability of the characterized pattern and structure occurring by chance.
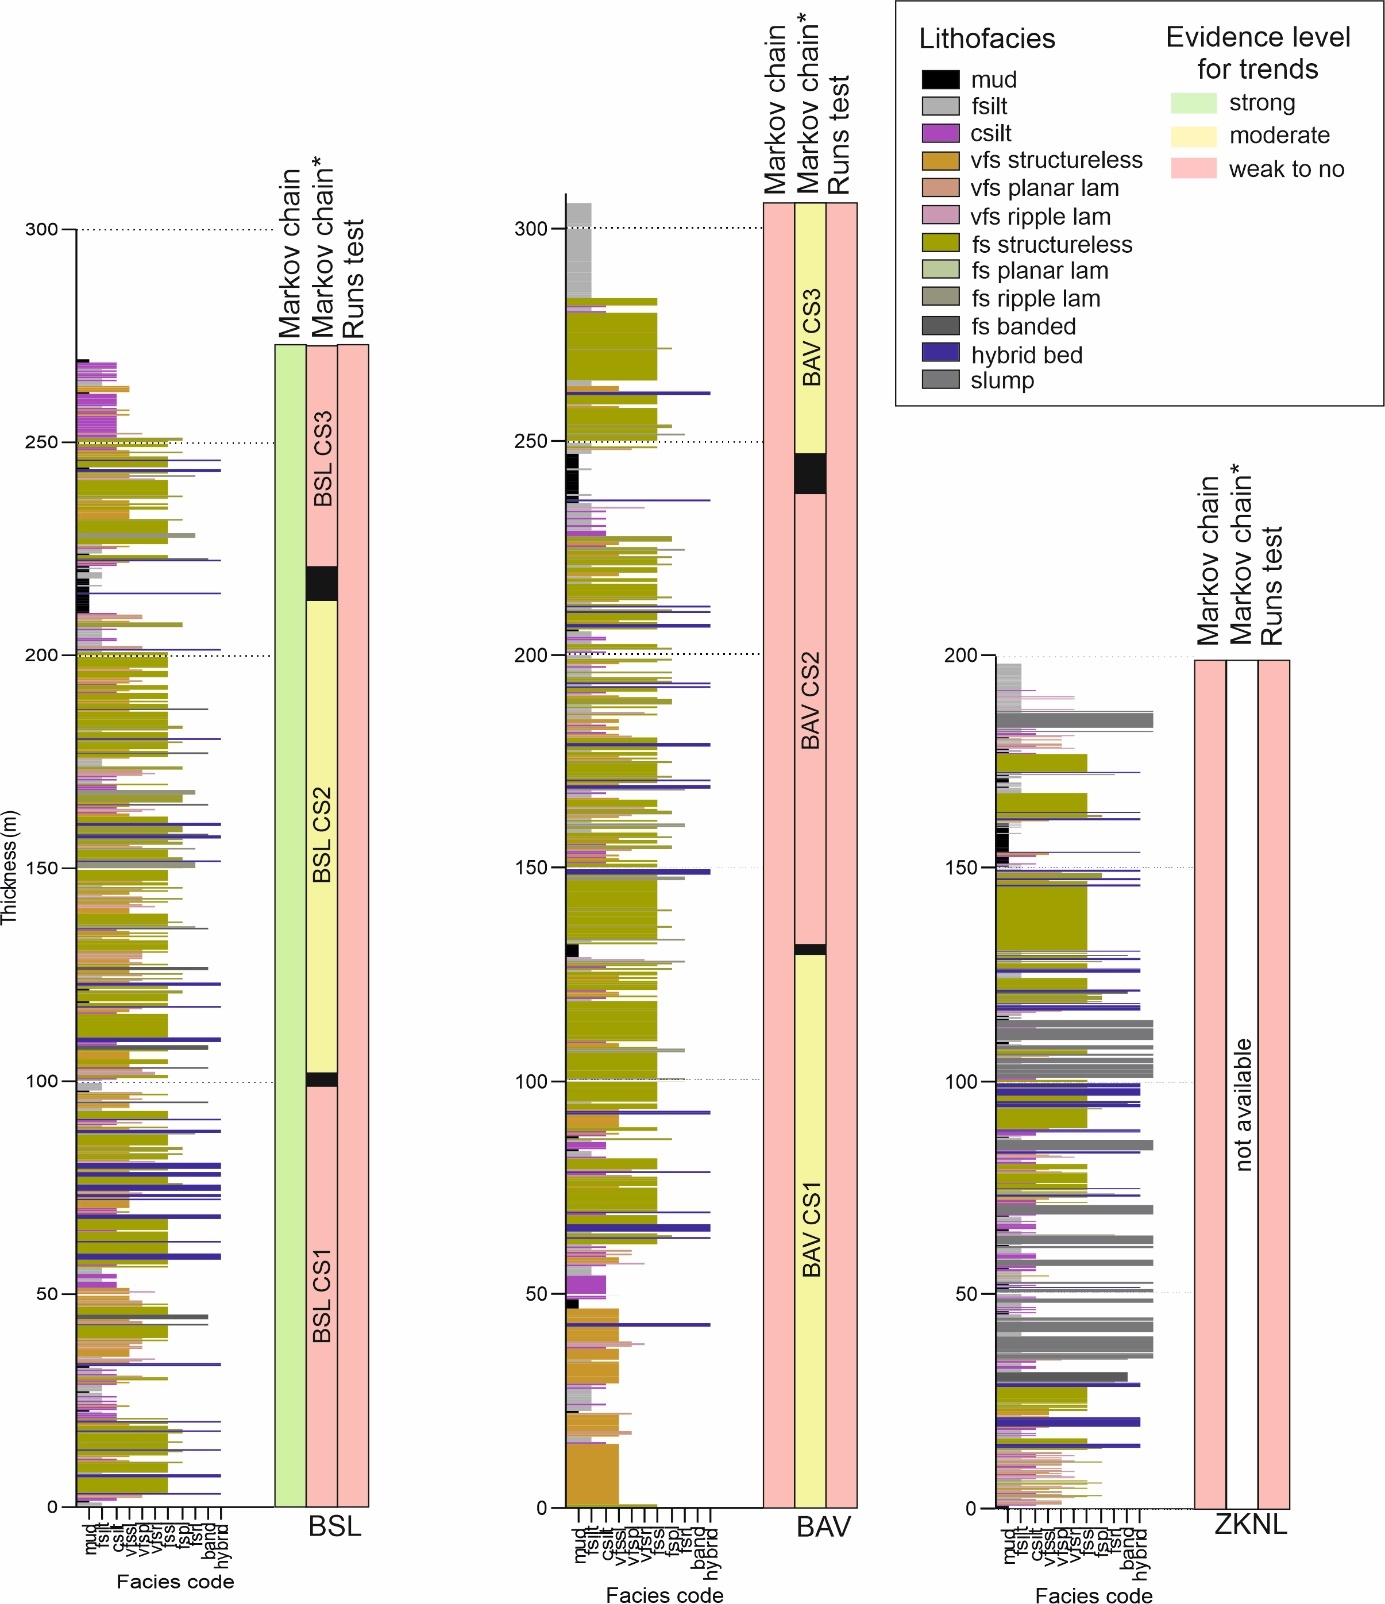
We first calculated the Markov and runs test analysis p values for the whole section of Unit A for the studied locations. We then divided sections BSL and BAV- 1 into the composite sequences BSL CS 1 – CS 3 and BAV CS 1 - CS 3 as interpreted by Flint et al. (2011) to assess the level of evidence present for ordered stacking patterns at the composite sequence level. Calculated p-values indicate strong evidence for facies succession order in BSL, and weaker but still perhaps significant evidence in SK-2 and RF (Table 1). Calculated p-values for the bed thickness metric all lie between 1 and 0.28, so there is no evidence for any bed thickening or thinning trends within these strata.
__prob.png)
Evaluation of the composite sequences of BSL and BAV- 1 produces similar results overall, but with some different details. Results of Markov analysis of the facies succession show moderate evidence for order in three of the six composite sections BSL-CS2, BAV CS1 and BAV-CS3. The level of evidence for individual composite sequences, however, does not correlate between the two sections, i.e. section BSL CS2 shows weak to no evidence for order, whereas BAV-1 CS 1 and CS 3 show moderate evidence order. Previous qualitative interpretations have suggested significant thickening and thinning trends in BSL/BAV CS 1 and BSL/BAV CS 3, but runs test analysis of bed thicknesses show no evidence for these thickening-up or thinning-up patterns.
Spectral analysis results
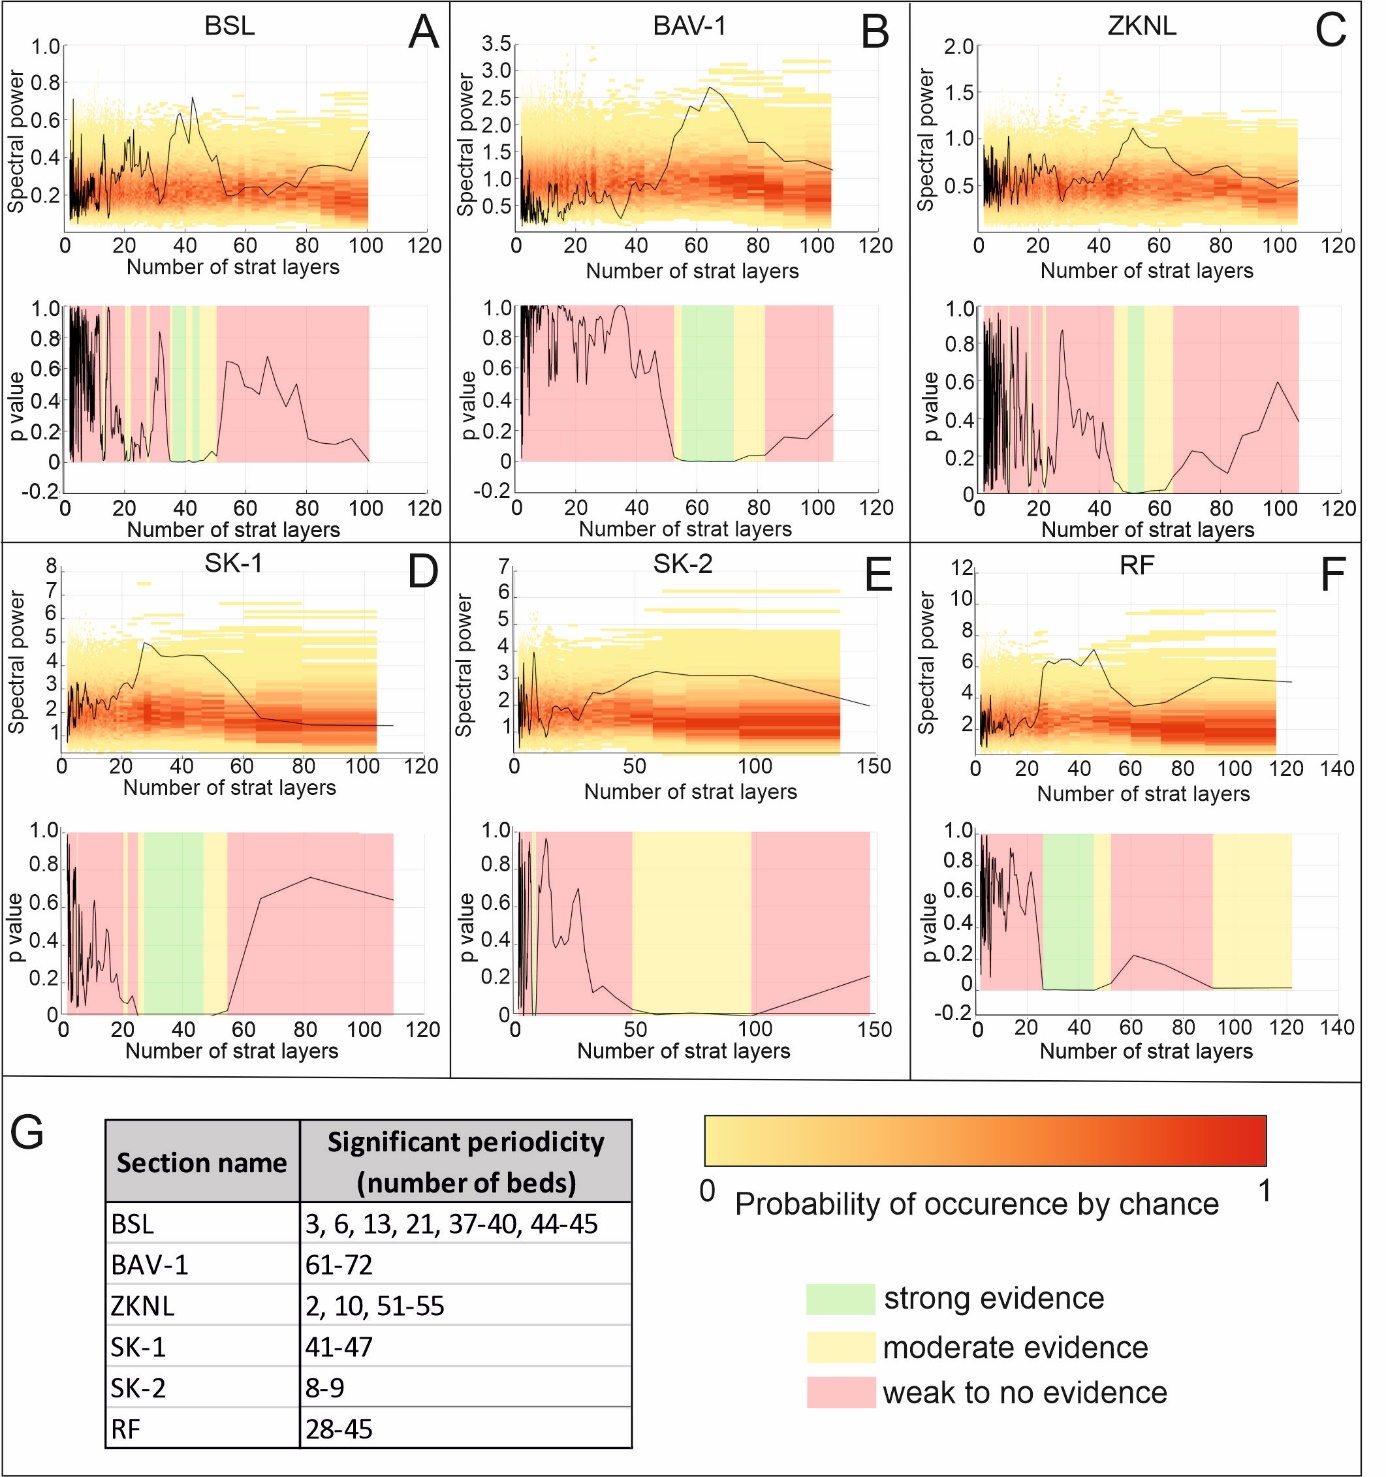
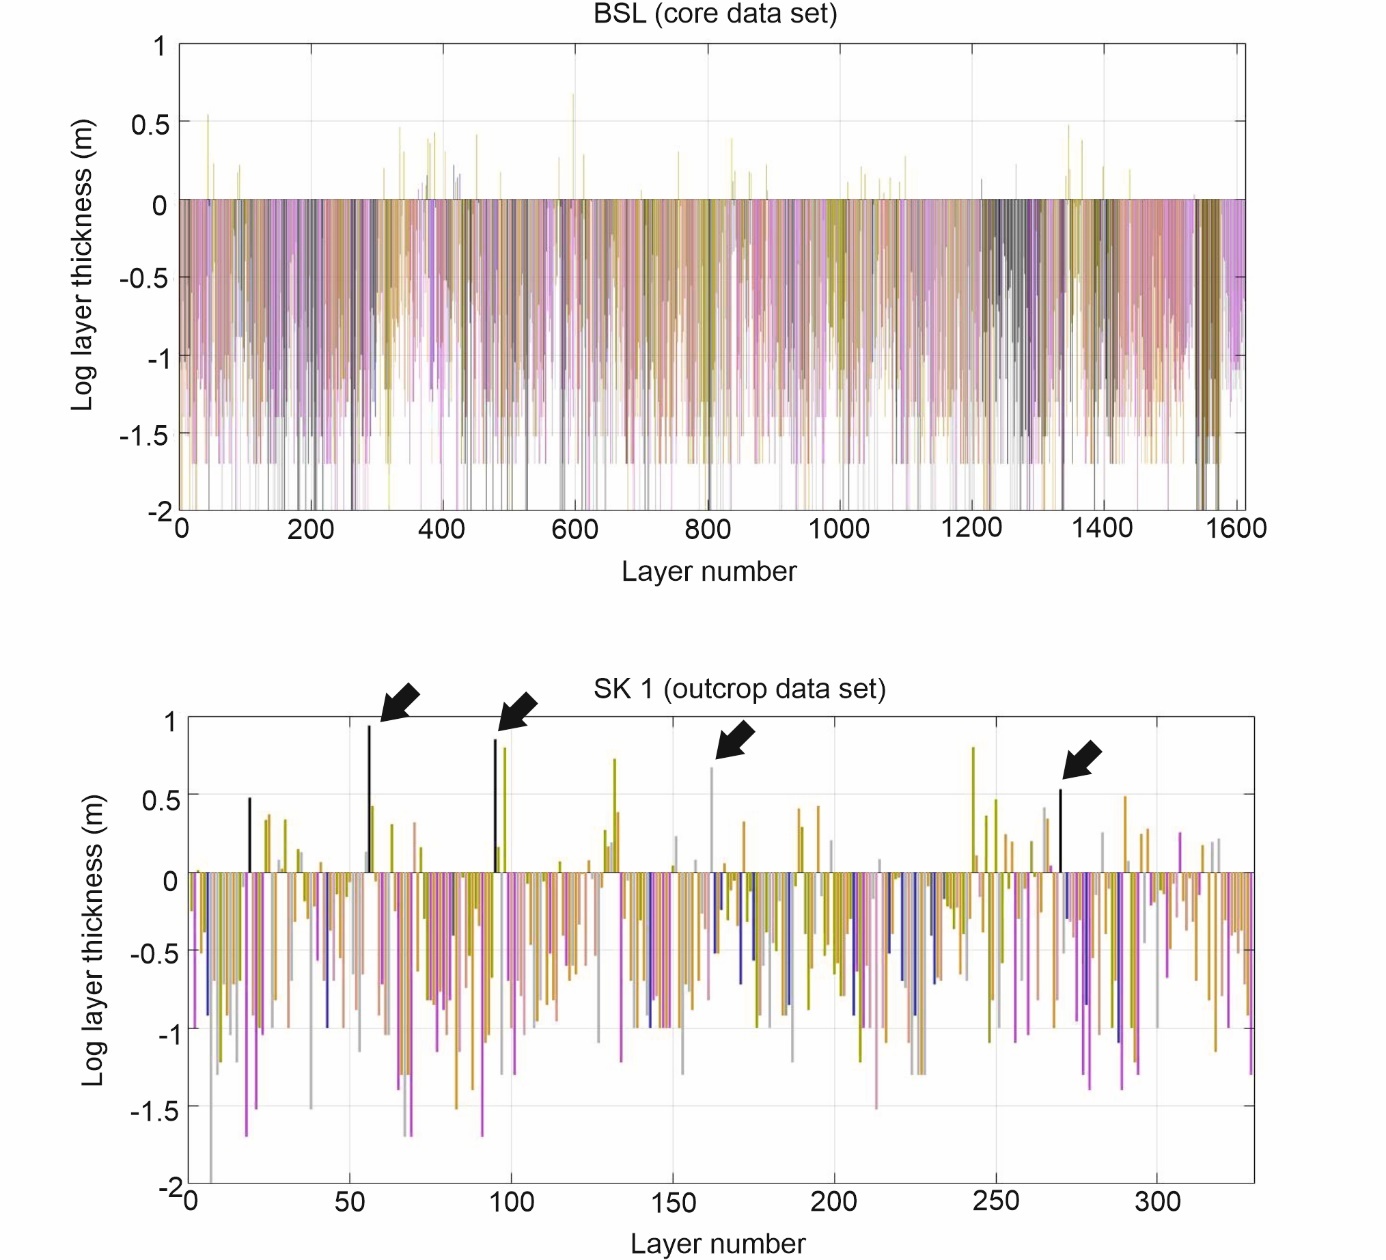
Spectral analysis calculates the power spectrum of an observed vertical succession. Elevated spectral power at particular frequencies indicate sinusoid-like repetitions of bed thickness patterns that, if shown to be unlikely to occur by chance, may indicate some element of order in the strata. To calculate the power spectrum of our vertical succession, we used the method from Burgess et al. (2019). Bed-thickness power spectra are compared to randomly shuffled equivalent beds; even disordered strata can, by chance, show elevated power at particular frequencies, so a robust test of statistical significance requires both spectral analysis of the succession and comparison to a randomized succession to avoid misinterpretation. We use an iterative Monte Carlo approach to compare the observed spectral power with 1000 realizations of a shuffled version of the same set of beds and calculate a p value indicating the probability that the observed power could arise from a randomly arrangement of the beds. By this method the p values indicate the level of spectral power required as reliable evidence for significant periodicities of bed thickness cyclicity (see Burgess et al., 2019). Note that sample size influences the resolution of the power spectra; power spectra calculated from outcrop datasets with fewer units logged are much smoother, with fewer sharply distinct peaks that are less prominent, and less significant compared to those recorded in the larger-sample-size, higher-resolution core data sets. Note also that no depth-time conversion is used or required in this analysis, so spectral power is plotted against number of stratigraphic layers (beds), not time. This is important because it avoids the circular logic that so often limits the validity of spectral analysis to test for specific external forcing frequencies or ratios of frequencies.
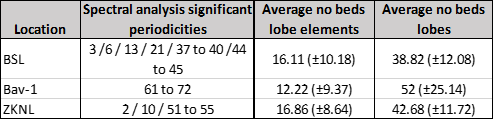
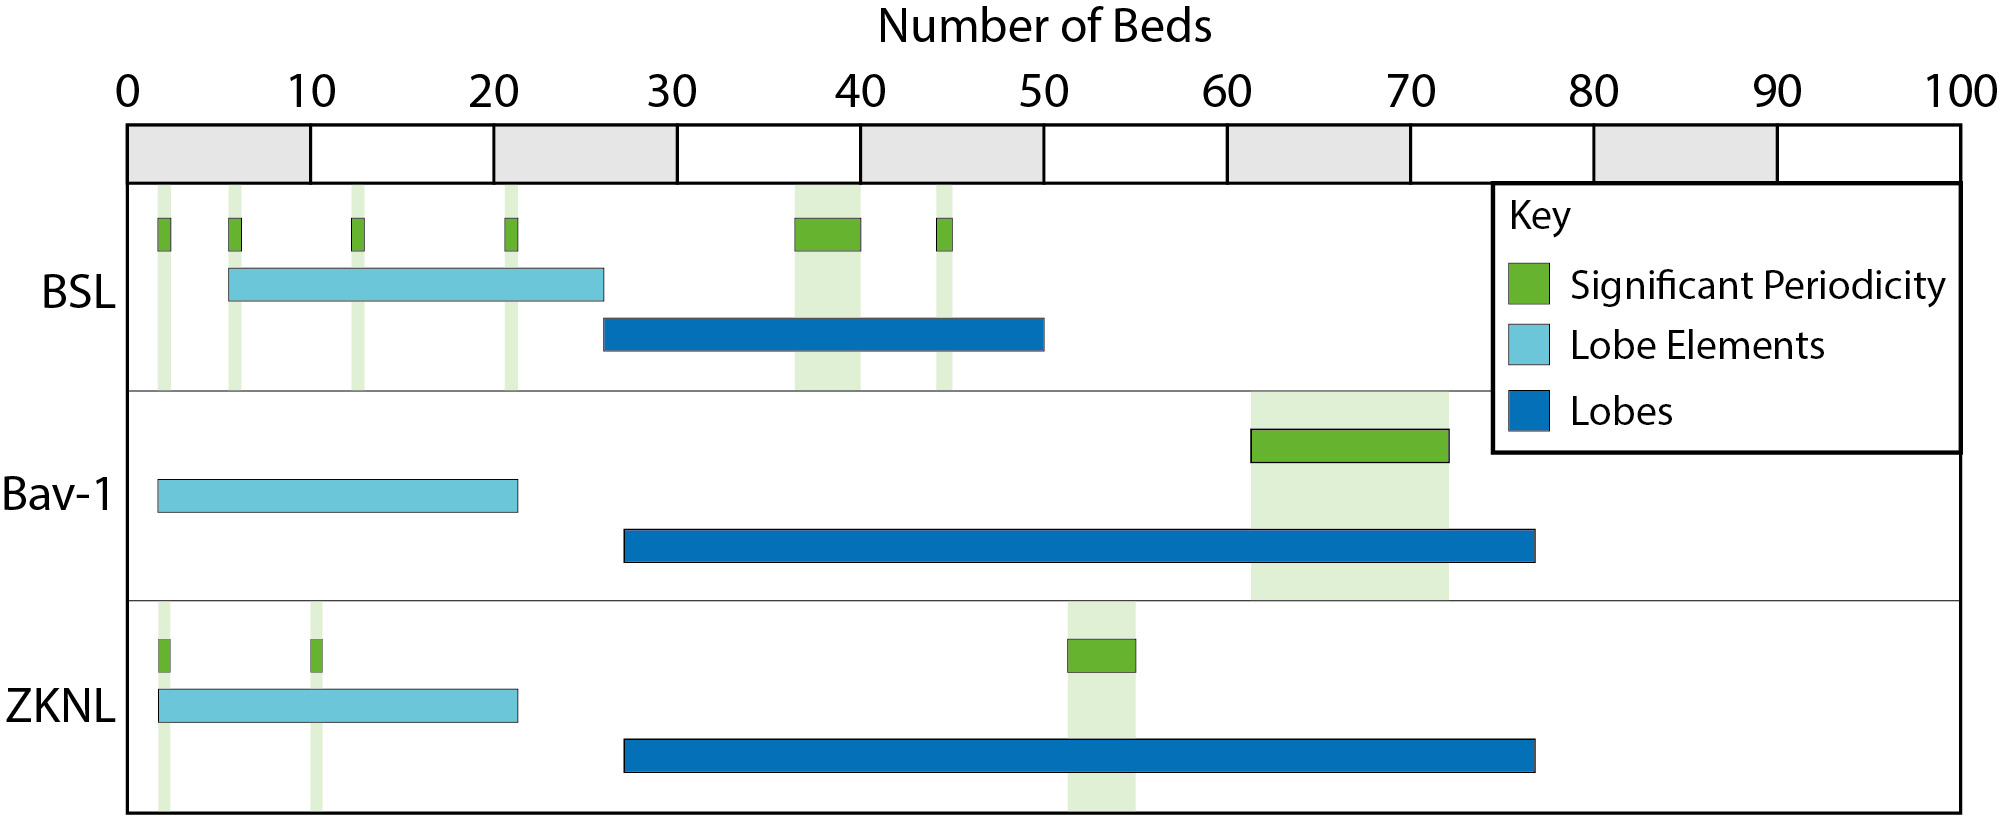
All of the six vertical sections show some evidence for one or more periodicity (Fig.2, Table Fig. 2G). BSL shows spectral peaks with p values less than 0.01 for frequencies of 3, 6, 13, 21, 37-40 and 44-45 beds. BAV-1 shows significant (p < 0.01) power from 61 to 72 beds. Section ZKNL shows significant power at a 2, 10 and 51-55 bed scale and SK_1 show significant power at frequencies ranging from 41 to 47 beds. Section RF shows a wide range of periodicities with significant p values (28 to 45 beds). SK2 is the only assessed profile which doesn’t show any cyclicity in the range of beds > 40. The only periodicity picked up in spectral analysis lies between 8 to 9 beds.
_bsl__b)_bav-1__c)_zknl__d)_sk-1_.jpeg)
DISCUSSION
Disorder in facies and thickness due to lobe deposits’ variable stacking patterns?
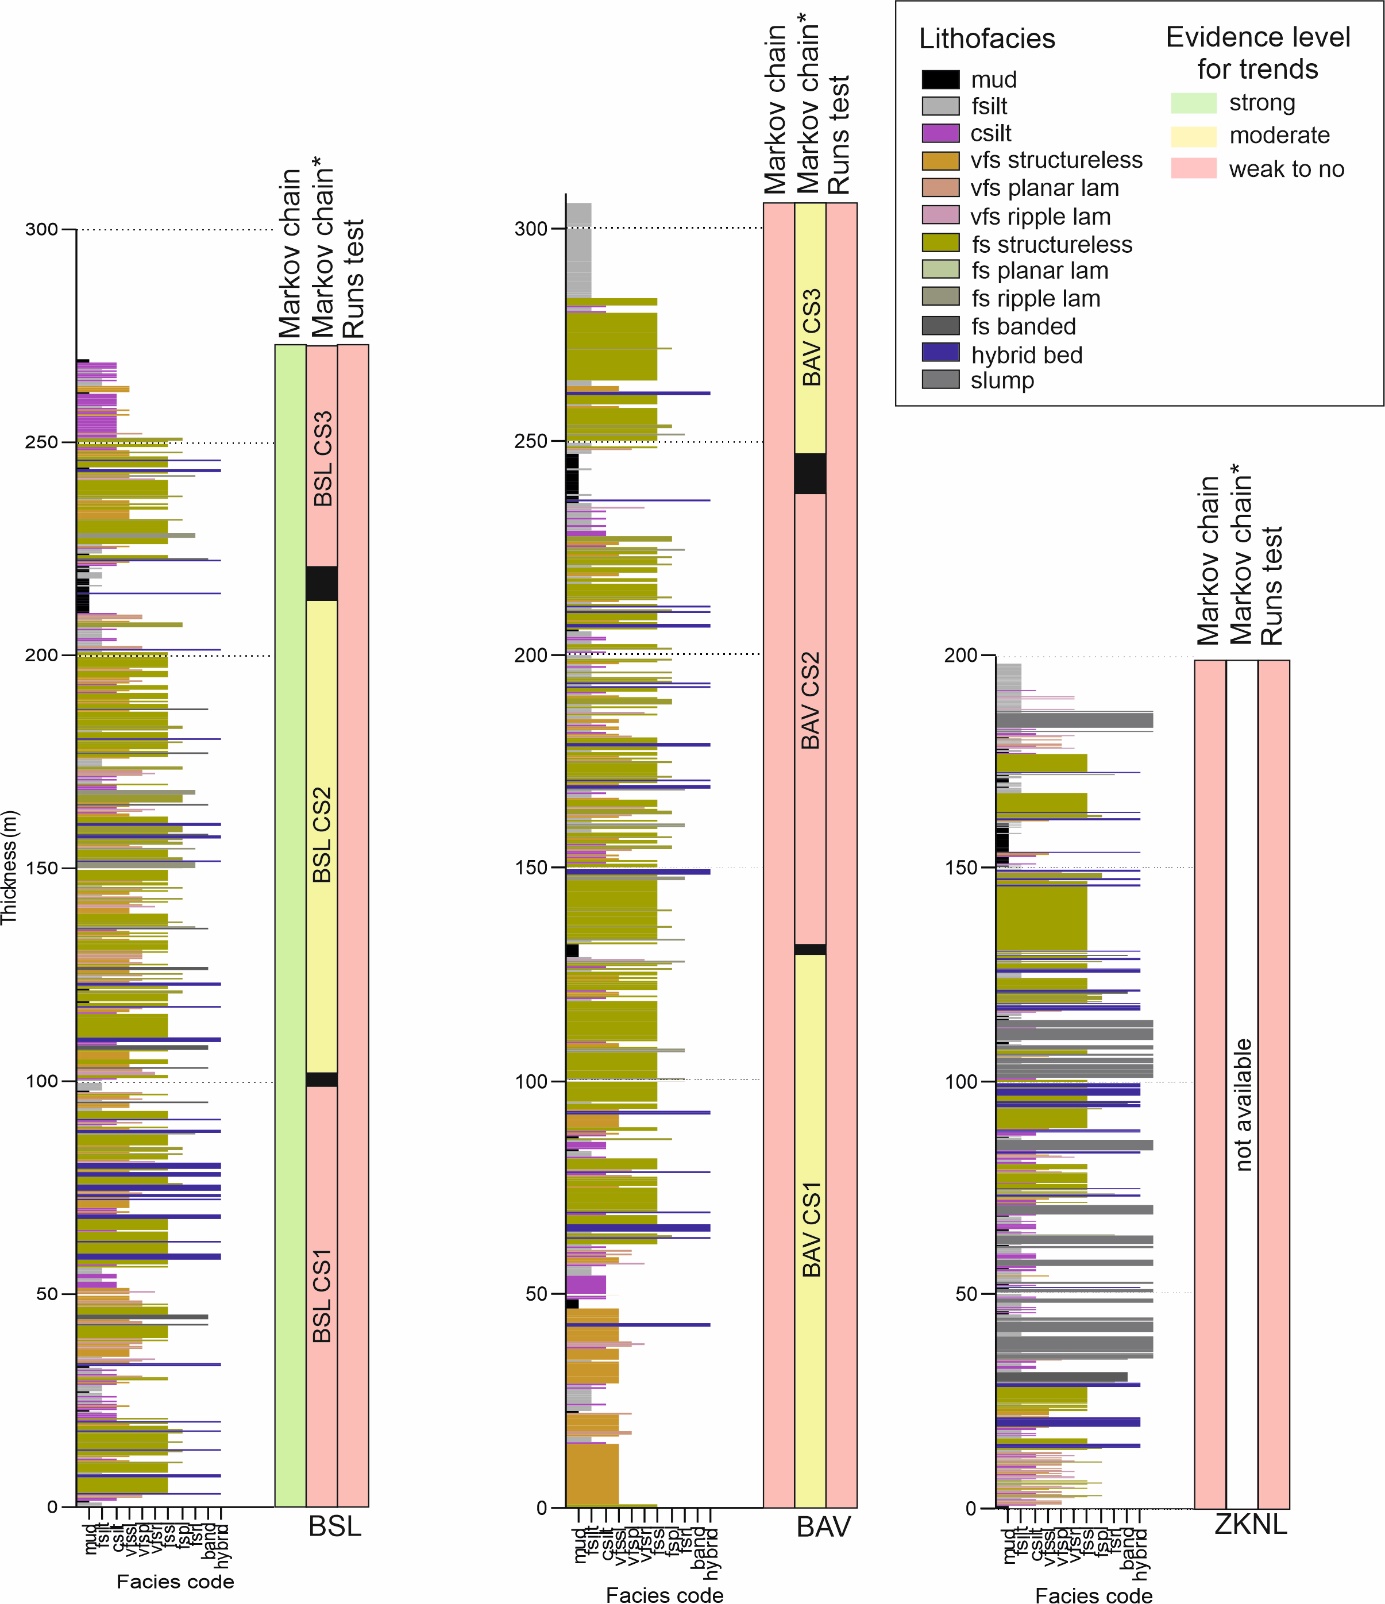
Evaluation of vertical depositional facies trends and overall thickness trends suggests Unit A of the Laingsburg Formation shows some evidence for order but the evidence is rather subtle (Fig. 3). Interestingly, this may actually be more consistent with overall interpretations of the depositional environment and flow processes than previous qualitative interpretations (Sixsmith et al., 2004; Spychala, Hodgson, Prélat, et al., 2017).
Hou et al. (2022) have used Markov chain analysis to evaluate order in the confined submarine fan of the Lower Atoka Formation (USA) that also show different results depending on the unit and section evaluated (less order indicated by lithofacies types). They suggested that, if observed, the order between two sections would not necessarily be the same due to the evolution of event frequency (Allin et al., 2016; Jobe et al., 2018). Considering this, lateral evolution of gravity flow types also has to be factored in when thinking about depositional facies trends over spatial distributed sections.
Another factor to be considered is the internal architecture of lobe deposits: By definition they are formed by the stacking of different lobe elements, which often represent variations in lobe sub-environments, unless truly aggradational deposition takes place. Less variation between sub-environments and their facies associations should lead to a higher perceived order than rigorous change between sub-environments. However, as ever even if a succession is dominated by only one sub-environment, order can be obscured by hiatal surfaces, that are the only record of order downstream or laterally. Additionally, evidence of one section with order in vertical facies trends may not be representative of the system as a whole. This suggests that at a minimum several vertical profiles need to be analysed to make any confident interpretation.
Results from the Markovian assessment of vertical depositional facies trends show strong evidence of order in the facies succession in BSL and moderate evidence for SK-2 and RF. When split into the suggested composite sets of Flint et al. (2011) only BSL CS2 shows even moderate evidence for order, while we get an indication that there may be more order to BAV-1 then indicated from the analysis of its complete section (BAV CS 1 and CS 3 indicate moderate evidence for order) (Fig. 3).
Results of runs tests analysis strongly refute interpretations of bed thickness trends of Unit A originally proposed by Sixsmith et al. (2004). They are not supported by quantitative analysis which suggest that autogenic factors play a more important factor than initially thought. Compensational stacking is defined as the tendency of deposits to fill topographic lows (Pyrcz et al., 2005; Straub et al., 2009; Straub & Pyles, 2012). This tendency is attributed to result from reorganization of the sediment transport field (Deptuck & Sylvester, 2018; Mutti & Sonnino, 1981). Compensation was assessed to be highest in deep-water lobe dominated settings and to occur on all hierarchical levels (Straub et al., 2009; Straub & Pyles, 2012). While Pyrcz et al. (2005) suggest that compensational cycles are identified as thickening-upwards sequences following general sequence stratigraphic ideas for parasequences, Prélat and Hodgson (2013) who assessed bed thickness patterns for Subunit A5 of Unit A empirically interpreted that lobes show a greater diversity of stacking patterns. In the case of Subunit A.5 thickening and thinning-upward patterns were assigned in equal proportions studying 99 lobes from several documented sections of Unit A.5., while thickening and thinning, thinning and thickening, and aggradational patterns could be observed as well.
Spychala et al. (2017) inferred compensational stacking patterns for lobe deposits Unit A from the distribution of hybrid beds. This may explain the perceived disorder in bed thickness trends but also in vertical facies trends indicated by Markov metric m in most sections. With compensational stacking the succession of lobe sub-environments characterized by different facies associations and bed thicknesses (e.g. Grundvåg et al., 2014; Prélat et al., 2009; Spychala, Hodgson, & Lee, 2017; Spychala, Hodgson, Prélat, et al., 2017) is predominantly steered by the location of topographic lows, rather than repetitive depositional cycles, e.g. parasequences, that can be observed in shallow marine successions for example (Van Wagoner et al., 1988). However, even these have been shown to exhibit no compelling evidence of order (Wilkinson et al., 2003). Hence, the weak evidence of bed thickness trends may be evidence for complex compensational stacking on a bed-by bed scale, as proposed by Ferguson et al. (2020) who suggested that compensational stacking obscures any upward thickening and thinning progradational and retrogradational patterns and detection of overall trends requires analysis of system scale geometries. In fact, many studies that have attempted using run tests for bed thickness analysis show no trend in deewater deposits (e.g. Chakraborty et al., 2002; Chen & Hiscott, 1999; Chester, 1993) This either 1) cements the idea that compensational stacking is a ubiquitous factor in all lobe deposits (including changes of thickness patterns through flow avulsion and bifurcation) and/or 2)runs tests are not a good method for analysing thickness data of lobate deposits.
System scale geometries of Unit A
On a regional scale a progradational, aggradational and retrogradational stacking of the lobe complex sets of Unit A can be observed (Flint et al., 2011; Sixsmith et al., 2004). The interpretation of lobe complex sets is reinforced by an extensive understanding of the overall geometry of depositional intervals in the Laingsburg depocenter. The interpretation of each subunit to represent lowstand system-tracts to a depositional sequence by Sixsmith et al. (2004), however, needs to be discussed. Results of numerical experiments of Burgess et al. (2019) suggest that dominant progradational and retrograditional trends at such bigger scales can result from autogenic migration of subsequently deposited lobate bodies as well as by allogenic forcing. Ferguson et al. (2020) suggested that the amount of progradation, rather than progradation itself, could be evidence of allogenic control. Their flume experiments suggest allogenic forces may amplify progradational and retrogradational patterns through alternation of channel bypass efficiency.
However, without detailed chronostratigraphic correlation of the Unit A deep-water strata with time-equivalent shelf and deltaic strata (Fildani et al., 2007; Flint et al., 2011) it is not really possible to meaningfully explore forcing by allogenic signals. Even with such correlation, data on past forcing processes is so limited and uncertain that such linkages tend to be much more tenuous than sequence stratigraphic models suggest. It is also not possible to exclude operation of allogenic forcing, for all the same reasons. We may have to accept that realistic interpretation of deep-water strata will always be limited in the absence of detailed chronostratigraphic data.
Order identified by spectral analysis
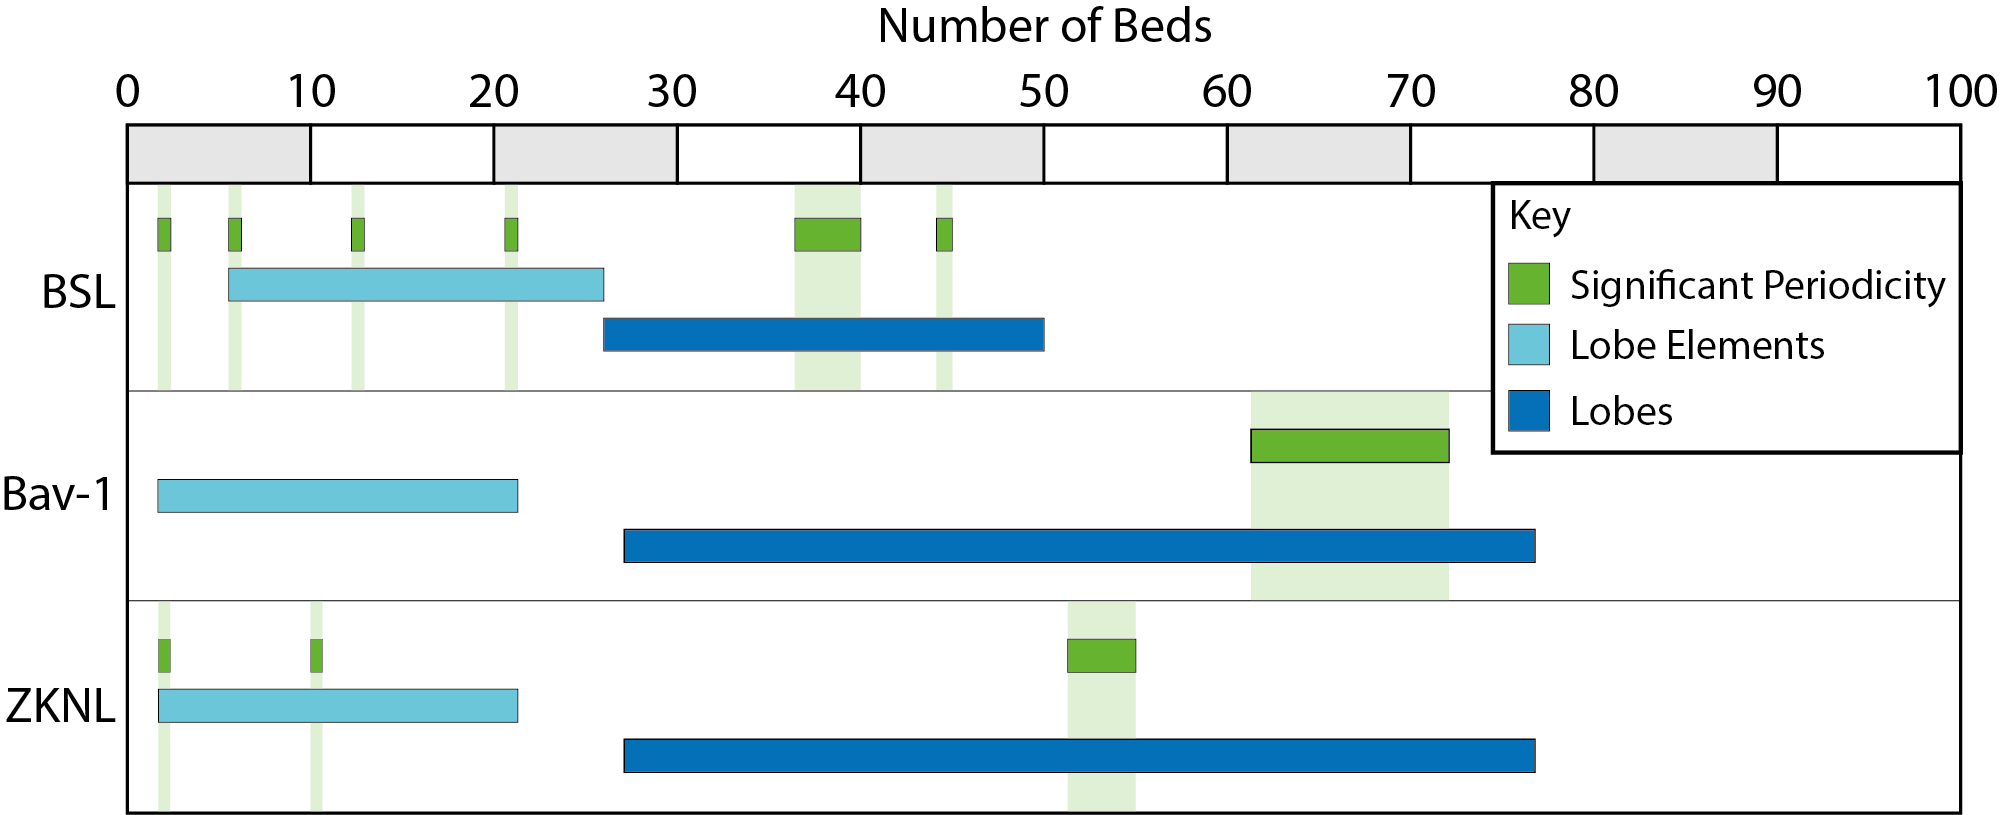
Spectral analyses show evidence for ordered strata at a range of periodicities, which variably overlap within the qualitatively interpreted architectural hierarchy comprising 181 lobe elements and 83 lobes (Table 2, Fig. 4). Apparently, this suggests that these periodicities may represent autogenic processes within the system, i.e. the stacking of lobe elements (~2-26 beds) and lobes (~28-76 beds) producing predictable sequences. However, the spectral peaks are not consistent between cores. For example, BSL and ZKNL record several spectral peaks in the lobe element range (2-26 beds) that are distinct from each other, whilst BAV-1 has none at all (Fig. 4). Very short periods (cycles) of only a few beds could also represent bed sets or successions that may occur and stand out even in randomly generated thickness data, which suggests to be cautious to assign too much meaning to them and concentrate on periodicities that span at least 10 beds. Spectral peaks within lobes (28-76 beds) are also different in each core: BSL 37-40 and 44-45, BAV-1 61-72, and ZKNL 51-55 (Fig. 4). If these spectral peaks are a product of repeated stacking of beds, lobe elements and lobes, then why are there differences between cores? Several factors could potentially influence the analyses: 1) natural variability in autogenic processes, 2) combined allo- and autogenic forcing, 3) stratigraphic incompleteness (sensu Straub et al., 2020), and 4) data input.

Considering autogenic processes drive order via compensational stacking of lobe elements and lobes to form predictable sequences in the geological record, a number of controls have been proposed that dictate when a lobe/element compensates including: channel avulsion (Hamilton et al., 2015) and depositional relief (Ferguson et al., 2020; Prélat & Hodgson, 2013; Straub et al., 2009; Straub & Pyles, 2012). Hence, the variability in spectral peaks may be the inevitable expression of how these factors are sensitive operators that act independently and in concert to influence the tempo of compensation and accommodation to fill before the next compensation cycle.
Second, the influence of allogenic forcing alongside autogenic processes will likely drive variability via reduction, amplification, overprinting or removal of external signals (Beerbower, 1964). If allogenic forcing influences local autogenic processes then the tempo of lobe/element compensation will be affected. For example, changes in sediment supply may affect different parts of a submarine fan in different ways (e.g. Burgess et al., 2019; Ferguson et al., 2020) and tectonic tilting episodes will exert significant influence at local and regional scales. In particular, Spychala et al. (2017) described a dynamic lateral slope to the margin of Unit A, that influenced thickness and facies patterns to the North of the studied area.
Third, a degree of stratigraphic incompleteness occurs in all successions due to the nature of using a 1D core or 2D outcrop to represent the deposits across a 3D system, and autogenic processes eroding antecedent deposits. Evaluating the degree of inherent incompleteness in in any given succession remains problematic due to insufficient chronostratigraphic resolution across geographically disparate sections. However, 3D numerical forward modelling of deep-water systems suggests that the highest levels of stratigraphic completeness are found in sections through the mid-axial zone of a fan with no more than 50-65% of stratigraphy actually preserved, with much lower preservation values across the proximal and distal zones (Burgess et al., 2019). Subsequent erosion/removal of stratigraphy will also affect completeness, which is relevant in the ZKNL section where repeated slides have remobilized primary deposits (Spychala, Hodgson, Prélat, et al., 2017). The stochastic nature of stratigraphic incompleteness will produce variability in spectral peaks between sections that is independent of any causal mechanisms.
Fourth, the statistical analyses are under-pinned by field data, which is collected and logged with the human eye. Different geologists will record successions with variations in the number of beds, facies and bed thicknesses. This may have an influence on the results from the spectral power analysis. This issue is particularly challenging when recording thin-beds.
The problem of thin-bed exposure
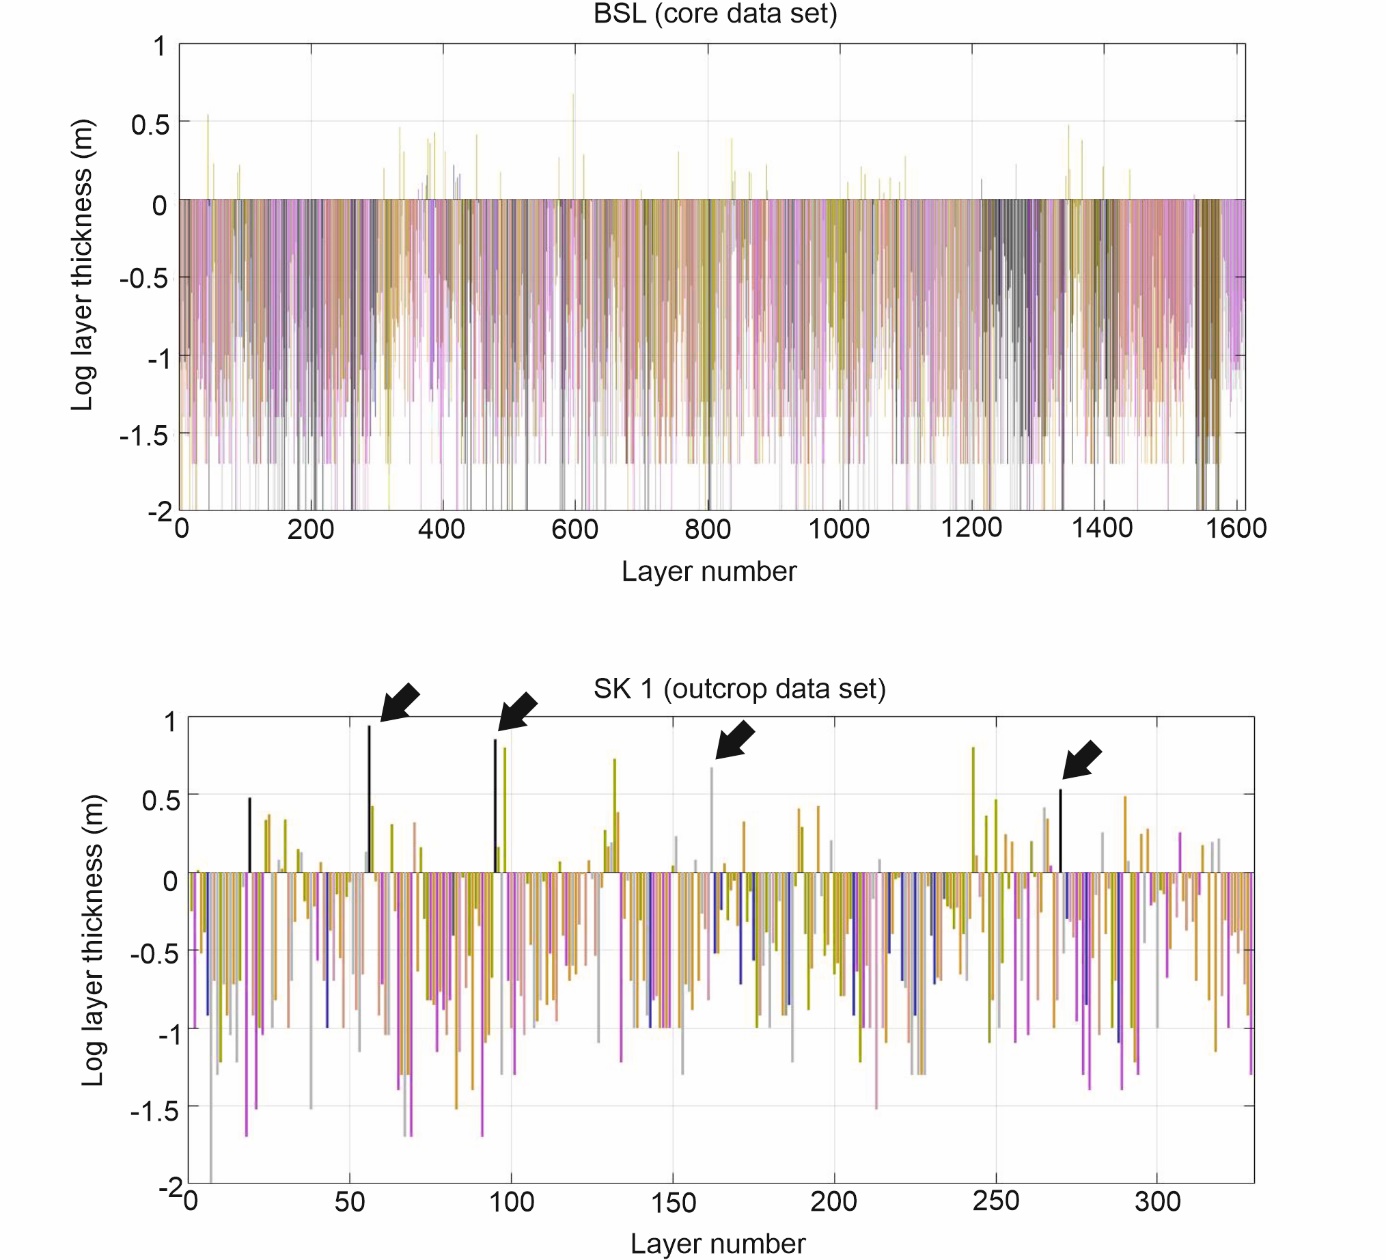
Thin-beds record the majority of events in deep-water systems (Hubbard et al., 2014). However, they may be commonly less well exposed in outcrop locations than their thick-bedded counterparts. Poor exposure impedes evaluation of both vertical trends and cyclicity of outcrop sections, but the impact of poor exposure on spectral analysis can be evaluated from outcrop data e.g. Figure. 5. Peaks calculated from outcrop sections with 70 % to 86 % record preservation (i.e. part of the succession that can be logged and evaluated) are less prominent and power spectra smoother overall, indicating missing data. Even if thin-beds are exposed reliable measurement of subtle grain size changes in fine-grained thin-bed strata is very difficult, leading to high uncertainty in assignment of varying facies. It follows data sets collected from high recovery cores (> 95 %) may be preferred as thin-bed preservation is commonly better, although during manual core logging not all beds may be identified due to operator error.
Implications for evaluation of signal preservation in submarine fan strata
With increasing awareness that stratigraphic sections may exhibit evidence of both allogenic and autogenic forcing, sequence stratigraphic models that emphasise allogenic forcing are increasingly questionable.
Several more realistic qualitative models have been introduced, e.g. the autogenic BCFS (Build, Cut, Fill, Spill) model and the allogenic AIGR (Adjust, Initiation, Growth, and Retreat) model to assess overlapping allogenic and autogenic process-responses (Gardner et al., 2008). As this model is derived from sequence stratigraphic ideas it allocates processes to the forcing factors using similar reasoning. The offset between local trends, which are thought to be strongly influenced by autogenic processes, and regional trends, which are interpreted to reflect allogenic processes was emphasized by Catuneanu (2020b, 2020a) alongside the need for reproducible stratigraphic trends that are connected to the trajectory of shoreline shifts. However, an intricate stratigraphic cycle is suggested to represent stratigraphic cycles, e.g. mudflows, slumps, hyper-concentrated and high-density currents pointing to deposition during a relative sea-level fall . These cycles are neither reproducible nor need deposition of these facies be connected to shoreline shifts.
For example, slides and slumps that occur at the base of Subunits A.3 and A.5 in the north of the Lainsburg depocenter could be taken for shoreline transit associated deposits connected to a relative sea-level fall, whereas they reflect the interaction of the turbidite system with internal dynamic basin topography (Spychala, Hodgson, Prélat, et al., 2017). The model also disregards extensive work documenting evolution of complex partitioning along the slope to basin floor transect (e.g. de Leeuw et al., 2018; Haughton et al., 2009; Hodgson et al., 2016; Hou et al., 2022; Maier et al., 2013; Prather et al., 2017; Prélat et al., 2009; Spychala, Hodgson, Stevenson, et al., 2017), which demonstrates how sediment gravity flows evolve under autogenic processes of the deep-water systems. We therefore agree that a regional view is essential, especially, when using sequence stratigraphic models that suggest specific facies succession, but the “modelling in disguise” inherent in many sequence stratigraphic interpretations with an implicit assumption of dominant allogenic control is not valid. Instead, integration of quantitative analyses of bed thickness and facies successions as a minimum level of evidence required for interpretation would substantially enhance sequence stratigraphic analyses allowing a shift from model-driven to more data-driven interpretations. Ultimately however, much better chronostratigraphic data and frameworks demonstrating regional allogenic forcing history will be required to fully resolve questions of allogenic and autogenic forcing of deep-marine strata.
CONCLUSIONS
Patterns of thickening, aggradation and thinning interpreted by Flint et al. (2011) in the sand-prone packages of Unit A of the Permian Laingsburg Formation in the Karoo Basin, South Africa are not reproducible in more detailed quantitative analysis of the succession.
Stratigraphic order is detectable in facies successions and spectral analysis, but not in bed thickness trends analysis. Results from the Markovian assessment of vertical depositional facies trends show strong evidence of order in the facies succession in BSL and moderate evidence for SK-2 and RF. When split into the suggested composite sets of Flint et al. (2011) only BSL CS2 shows moderate evidence for order, with some indication of order in BAV-1. Runs test show no evidence for bed thickness trends indicating that complex autogenic compensational stacking processes control individual depositional events in point locations, even when larger-scale trends do occur in regional stacking of lobes and lobe complexes. Spectral analyses show evidence for ordered strata at a range of periodicities, which variably overlap within the qualitatively interpreted architectural hierarchy comprising 181 lobe elements and 83 lobes. This suggest that in a bed-by-bed analyses signals of autogenic processes overprint any influence of allogenic signals.
In summary, this analysis suggests that sequence stratigraphic interpretations of outcrop and core deep-water strata will be more robust with integrated quantitative bed thickness and facies trend analysis as a standard approach. Sequence stratigraphic interpretations of deep-water strata should avoid a model-driven single dominant control approach, and instead use the quantitative analysis to more fully explore the typical complexity of these strata.
Acknowledgements
Outcrop and core data were initially collected as part of the LOBE 2 JIP. Outcrop and core data were initially collected as part of the LOBE 2 JIP. We thank David Hodgson for permission to use the data. We would also like to extend our gratitude to three anonymous reviewers who helped to tighten up the focus and clarity of our paper.
Supplemental material
-
Workflow
-
Moving Window Analysis