

INTRODUCTION
Ooids are non-skeletal, subspherical carbonate grains that form in shallow marine environments as oriented crystals grown concentrically around a nucleus. The structure of ooids—their crystal orientations and petrographic properties—can preserve a record of the conditions under which they originally formed and were subsequently altered, as ooid morphology depends on environmental conditions such as water chemistry, sediment transport regime, abrasion, biological activity, and the primary mineralogy of the ooid (Anderson et al., 2020; Diaz & Eberli, 2019; Howes et al., 2024; Riaz et al., 2024; Sandberg, 1975; Simone, 1980; Trower et al., 2017). Thus, ooid crystallography can be used as a tool for reconstructing both paleoenvironmental conditions and post-depositional diagenesis (Hood & Wallace, 2018; Medwedeff & Wilkinson, 1983; Sandberg, 1975; Wilkinson et al., 1984).
Here we explore whether ooid crystallography may help us better understand shallow marine environments at the onset of the largest negative carbon isotope excursion in Earth history, the Shuram excursion (e.g., Bergmann et al., 2025; Busch et al., 2022; Grotzinger et al., 2011; Schrag et al., 2013). The Ediacaran Shuram excursion (573-568 Ma) records δ13C values as low as -12‰ (VPDB; e.g., Bergmann et al., 2025; Busch et al., 2022; Fike et al., 2006; Grotzinger et al., 2011). Both dolomite and calcite ooids are commonly associated with this excursion in multiple locations worldwide (e.g., Bergmann et al., 2011, 2025; Corsetti et al., 2006; Melezhik et al., 2009). We focus on dolomite ooids from the upper Khufai Formation in Oman that record the onset of the Shuram excursion (Bergmann et al., 2025; Le Guerroué et al., 2006; Osburn et al., 2014).
Our primary objective is to address whether these ooids originally precipitated as calcite or aragonite and were later altered to dolomite, or whether they precipitated directly as dolomite. Resolving their original mineralogy is key to interpreting both primary environmental conditions and the extent of diagenetic overprinting. We address this question using electron backscatter diffraction (EBSD) and synchrotron-based polarization-dependent imaging contrast (PIC) mapping to resolve crystal orientations at high spatial resolution. We compare our results from the Khufai oolite to two other dolomite fabrics the same Ediacaran succession in Oman: spherulitic dolomite from a conical stromatolite, and multiple generations of dolomite cements from a supratidal tepee-pisolite complex. For broader context, we also draw on previously published EBSD and PIC maps of calcite and aragonite ooids (Bergmann et al., 2025; Dickson, 2023; Frazier, 2024; Mono et al., 2025), along with additional observations of radial calcite ooids from the Ediacaran and Cambrian presented in the Supplemental Materials. Together, these analyses reveal crystallographic features that distinguish primary dolomite precipitation from secondary mimetic dolomitization, and imply that environmental conditions in shallow open marine environments at the onset of the Shuram excursion approximated the extreme conditions that permit dolomite formation today.
MATERIALS AND METHODS
Geological Setting and Sample Collection
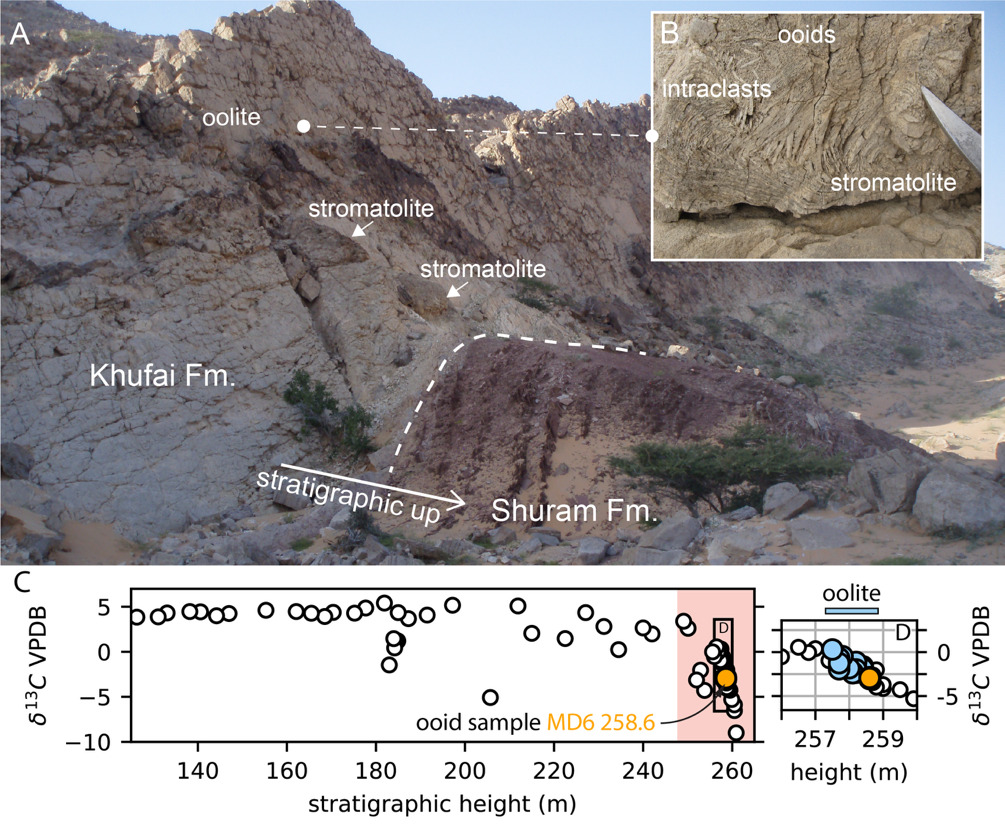
The upper Khufai oolite is a 1−30 m thick, cross-stratified ooid grainstone deposited in a high-energy, shallow marine setting with stromatolite bioherms and intraclasts (Figure 1A, B; Supplemental Figure 1). In our studied sections at Mukhaibah Dome and Khufai Dome of the Huqf outcrop area, Oman, δ¹³C values decrease from 0.3 to −2.98‰ (VPDB) across the 1.1 m-thick oolite, marking the onset of the Shuram excursion (Figure 1C, D) (Bergmann et al., 2025). Supplemental Table 1 contains sample information and Supplemental Table 2 has analytical coverage for the oolite and comparison samples.

The overlying Shuram Formation begins with siliciclastic red-to-purple siltstone, followed by limestone oolites that record the excursion nadir (δ¹³C values as low as −12‰ VPDB; Bergmann et al., 2025; Le Guerroué et al., 2006). These calcitic ooids are smaller than the dolomitic Khufai ooids, with cortices composed of radial crystals that are length-fast and acicular (straight and needle-like) (Supplemental Figures 2-3) (Bergmann et al., 2025). In Oman, the negative δ¹³C values that define the Shuram excursion recover within the overlying Buah Formation. In the Huqf outcrop area and in subsurface penetrations, the late Ediacaran Birba Formation overlies a subaerial unconformity at the top of the Buah Formation (Gómez-Pérez et al., 2024).
Analytical Coverage
Our analytical coverage (Supplemental Table 2) included six thin-sections of Khufai Formation oolite samples from Mukhaibah and Khufai Domes imaged with plane- and cross-polarized light microscopy (Supplemental Figure 4). One oolite hand sample from Mukhaibah Dome (MD6 258.6m; Figure 2A-E) underwent additional analysis: stitched microscopy of the entire thin section at 5× magnification (Supplemental Figures 5-6); Scanning Electron Microscopy (SEM) imaging of acid-etched and unetched regions (Supplemental Figure 7); Electron Probe Microanalysis (EPMA) elemental mapping of two regions containing 17 and 7 ooids respectively with 37 EPMA spot measurements of Ca, Mg, Fe, Sr, and Mn in ooids and 14 spot measurements of sediment; EBSD and Energy Dispersive Spectroscopy (EDS) mapping of two ooids and partial mapping of four additional ooids (yellow region 1 (R1) and region 2 (R2) in Figure 2B; Supplemental Figure 8); and PIC mapping of one-quarter of one of the EBSD-characterized ooids (Figure 2B, orange box).
Comparative Samples
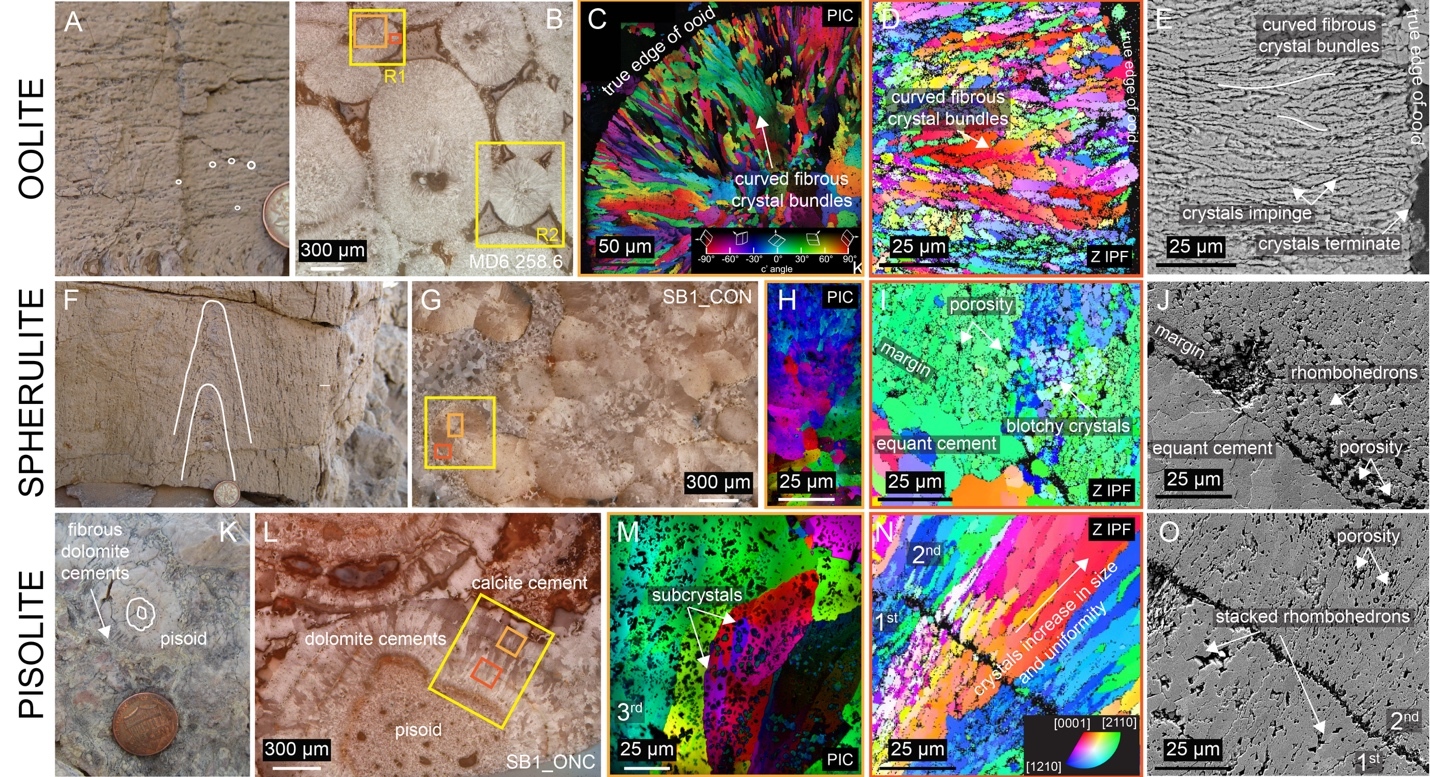
For comparison with the EBSD and PIC results from the Khufai Formation oolite sample, we examined two dolomite samples from the overlying Buah and Birba Formations that preserve fine-scale fabrics. The first comparative sample (SB1_CON) is from a conical Conophyton stromatolite in the upper Buah Formation with heavy δ¹³C values of +7‰ (VPDB), which contains spherulitic dolomite laminae with sweeping sinistral extinction (counterclockwise extinction with clockwise stage rotation) (Figure 2F; Supplemental Figure 9; Supplemental Movie 1). SEM imaging was completed of acid-etched and unetched spherulites (Supplemental Figure 9), EDS and EBSD were conducted on one spherulite, and a portion of that same spherulite was analyzed with PIC mapping (Figure 2G-J; Supplemental Figure 10).
The second comparative sample (SB1_ONC) contains multiple generations of fascicular-optic dolomite cement with counterclockwise extinction precipitated between pisoids within a supratidal tepee-pisolite complex of the Birba Formation (Figure 2K; Supplemental Movie 2). SEM imaging was completed on acid-etched and unetched cements filling cavities between pisoids (Supplemental Figure 11), EBSD and EDS conducted on one region of cements (Supplemental Figure 12), and a subregion of cements was analyzed with PIC mapping (Figure 2L-O).
For additional context, we also include petrographic images and SEM imaging of etched and unetched regions from two calcite oolite samples in the Supplemental Materials: an Ediacaran calcite oolite with radial acicular crystals from the Shuram Formation in Oman (Supplemental Figures 2-3) and Cambrian calcite ooids from the Petit Jardin Formation, Newfoundland, with radial acicular crystals partially replaced by dolomite (Supplemental Figure 13). XRD analysis was completed on 47 dolomite samples from the Ediacaran stratigraphy in the Huqf region, including the MD6 258.6m oolite sample, three other oolite samples, and nine other samples from the onset of the Shuram excursion (Supplemental Figures 14-18).
Sample Preparation
Sample preparation varied by analytical technique. For PIC mapping, each sample was cut to a 4 mm × 4 mm square cross section, embedded in epoxy, polished with Al2O3 down to 50 nm, and coated with 1 nm of Pt following De Stasio et al. (2003). These samples were subsequently repolished with colloidal silica and carbon-coated for EBSD and EDS analysis. Remaining samples were thin-sectioned, polished to 0.25-µm thickness for petrographic observation, and carbon-coated for EPMA spot analysis and elemental mapping. For X-ray diffraction (XRD), aliquots from the three samples were powdered using a drill press.
Scanning Electron Microscopy (SEM), Electron Probe Microanalysis (EPMA), and X-Ray Diffraction (XRD) Analysis
Small regions on the polished thin sections were acid-etched using 10% HCl for 30 seconds before SEM analysis. SEM imaging and EDS elemental mapping were conducted using a Hitachi TM4000II microscope at MIT, operated at 10 kV accelerating voltage for imaging and 15 kV for elemental mapping, at a working distance of 8.5 mm under low vacuum.
EPMA spot analyses were performed using a JEOL JXA-8200 electron microprobe at the California Institute of Technology with an accelerating voltage of 15 kV, beam current of 20 nA, and beam size of 1 µm. Ca, Mg, and Mn were calibrated using calcite, dolomite, and rhodochrosite in-house standards with detection limits of 177-300 ppm.
Powder XRD data were collected on a PANalytical X’Pert Pro (California Institute of Technology) using Cu Kα radiation (45 kV, 40 mA) over 5–70° 2θ, step size 0.008°, and 10.16 s per step. Background was removed with a rolling-median filter (0.6° 2θ window); peak heights were measured on the baseline-corrected signal (Supplemental Figure 14). Peak positions were identified as the tallest local maximum within ±0.30° of standard positions (quartz (101) 26.6737° 2θ, RRUFF R040031; dolomite standard from RRUFF R040030, e.g., (104) 31.00°, (110) 37.42°, (015) 35.37°, (021) 43.85°) (Supplemental Figure 15). All reported 2θ values were corrected by a constant +0.09°, equal to the average deviation of the quartz (101) reflection from the standard, computed from 17 of 47 scans with strong quartz (101) reflections (mean 26.76°; 1σ = 0.05°; I>50 after baseline correction). Dolomite ordering was quantified as I(015):I(110) (following Goldsmith & Graf, 1958; Manche & Kaczmarek, 2021) (Supplemental Figure 16). Following Pina et al. (2020), we also calculate HWHM(104) = ½·FWHM(104) and Δ2θ(104) = (104) – 31.00° (Supplemental Figures 17-18).
Electron Backscatter Diffraction (EBSD)
Full, 3-D crystal orientations were mapped using a ThermoFisher Helios Hydra 5 SEM equipped with an Oxford Instruments Symmetry S3 EBSD detector, located at the Marine Biological Laboratory (Woods Hole, MA). EBSD data were collected at 25 kV accelerating voltage, 51 nA beam current, 15 mm working distance, 156 × 128 EBSD detector resolution (“Speed 4” mode), 0.5 ms dwell time, and with 2× frame averaging, yielding an EBSD acquisition speed of ~1000 Hz. Samples were mapped at step sizes of either 0.25 µm or 0.50 µm.
For all inverse pole figure maps, except for those from region R2 in Figure 2B, pixels that did not yield clear Kikuchi patterns were left non-indexed rather than interpolated using neighboring pixel data, as these regions often corresponded to genuine porosity. These maps were analyzed using the open-source MTEX toolbox for MATLAB (Bachmann et al., 2010). A 10º misorientation threshold was used to assign pixels to crystals. For each pixel belonging to a grain with aspect ratios >1.5 and containing >10 pixels, the angle between the c-axis and the grain long axis (hereafter referred to as the “c-axis to elongation” angle) was measured. Region R2 from sample MD6 258.6m was mapped at 500 nm step size, then reindexed using Oxford Instruments’ MapSweeper to increase indexing from ~56% to ~99%. The map was refined through pattern binning, iterative repair of clusters containing ≤ 5 wild-spike or non-indexed pixels, and removal of pixels with cross-correlation coefficients R < 0.2.
Polarization-dependent Imaging Contrast (PIC) Mapping
Crystal morphologies and orientations were also mapped at nanoscale resolution using polarization-dependent imaging contrast (PIC) mapping (DeVol et al., 2014) to supplement EBSD mapping. We produced high-resolution maps of crystal orientations and geometries within one 400 μm-diameter ooid from the upper Khufai oolite, one area of the spherulitic dolomite from the conophyton stromatolite, and a dolomite cement horizon from the pisolite sample.
PIC mapping uses soft X-rays with a variable linear polarization angle to measure the optic-axis orientation of crystals (e.g., the c-axis for dolomite), displaying them in 3D, with 20 nm resolution and 56 nm pixels. Hue and brightness represent in- and out-of-plane angles, respectively (Gilbert et al., 2011). Based on X-ray linear dichroism, this technique has been applied to aragonite, calcite, and vaterite (DeVol et al., 2014; Gilbert, 2023; Lew et al., 2023) and is demonstrated here for dolomite.
Data were collected on beamline 11.0.1.1 at the Advanced Light Source, Lawrence Berkeley National Laboratory, using X-ray PhotoEmission Electron spectroMicroscopy (X-PEEM) (De Stasio et al., 1998, 1999). Samples were mounted at 60° to the incident X-ray beam. At 534 eV, the linear polarization direction was rotated from 0° to 90° in 5° increments, generating 19 images processed using GG Macros (Sun et al., 2021). Intensity (I) versus polarization angle (χ) curves were fit using Malus’s law: I = a + bcos²(χ − c′), with parameters (a, b, and c′) representing the in-plane and out-of-plane angle of the crystal c-axis orientation in polar coordinates (DeVol et al., 2014; Gilbert et al., 2011).
RESULTS
Mineralogy
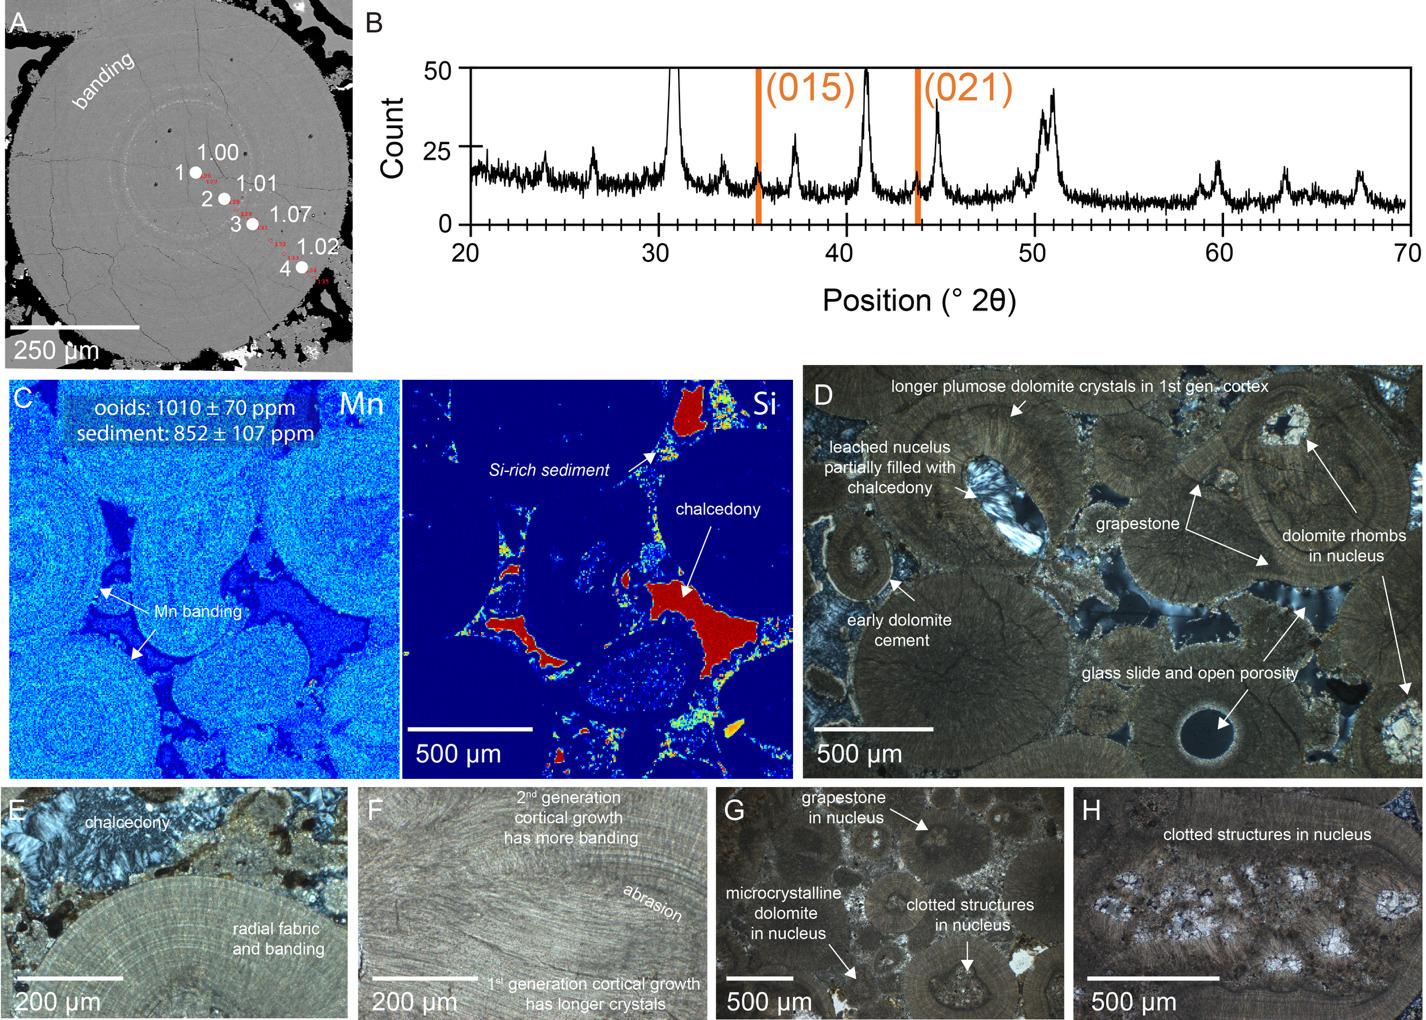
EPMA Ca/Mg ratios (Figure 3A) and XRD ordering peaks (015) and (021) (Figure 3B) indicate that the oolite comprises ordered dolomite with Ca and Mg in near equal parts. EPMA spots 1−4 in Figure 3A yielded Ca/Mg molar ratios of 1.00, 1.01, 1.07, and 1.02, respectively. The average Ca/Mg molar ratio of all spot measurements is 1.01 (±0.01, 1 SE, N = 37). Ooids have an average Mn concentration of 1010 ppm (±70, N = 37) compared to 852 ppm in sediments (±107, N = 14). Average Fe concentrations are 3342 ppm in the ooids (±159, N = 37) and 5352 ppm in the sediments (±931, N = 14). Errors are reported as one standard error (SE). The degree of ordering in the oolite ranges from 0.44 to 0.62 across the Huqf region based on (015)/(110) reflection ratios (N = 4), with an ordering ratio of 0.50 for sample MD6 258.6m (Supplemental Figures 16-18). The (104) reflection at 30.91° confirms Ca/Mg stoichiometry near 1. The SEM images (Figure 3A; Supplemental Figure 7), elemental map of Mn (Figure 3C, left), and phase map from EBSD (Supplemental Figure 8B) all show concentric banding in ooid cortices. Ooids are surrounded by Si- and Fe-rich sediment and either silica cement or preserved open porosity (Figure 3C, right).

Petrography
The upper Khufai oolite contains fibrous, radial, dolomitic ooids ranging in diameter from ∼250 to 1500 μm. The ooids have well-defined nuclei with radially-oriented crystals making up the ooid cortices (Figure 3D, E) and minimal internal porosity (Figure 2E; Figure 3F; Supplemental Figure 7). Closely spaced (< 10 μm) concentric banding is visible in the cortices (Figure 3E; Supplemental Figure 8), with occasional small fractures where ooids are in contact with one another. Individual radial crystals can span tens of microns in length across multiple bands (Figure 3F).
Larger ooids contain two distinct generations of fibrous dolomite crystals within the cortex (Figure 2D; Figure 3D, F). First-generation crystals are longer, with more curvature and minimal banding. Second-generation crystals nucleate on abraded surfaces with regular banding.
Ooid nuclei exhibit four distinct fabrics: small, equant dolomite crystals (5–20 μm); irregular clotted fabrics with possible residual organics; multiple irregular grains cemented together like grapestone; and coarse, blocky, rhombohedral dolomite crystals, approximately 50−100 μm in diameter (Figure 3D, G, H). Some nuclei are dissolved, leaving dolomite cortices intact but with nuclei either open or filled with botryoidal chalcedony (Figure 3D).
Crystal Morphology and Crystallographic Orientation
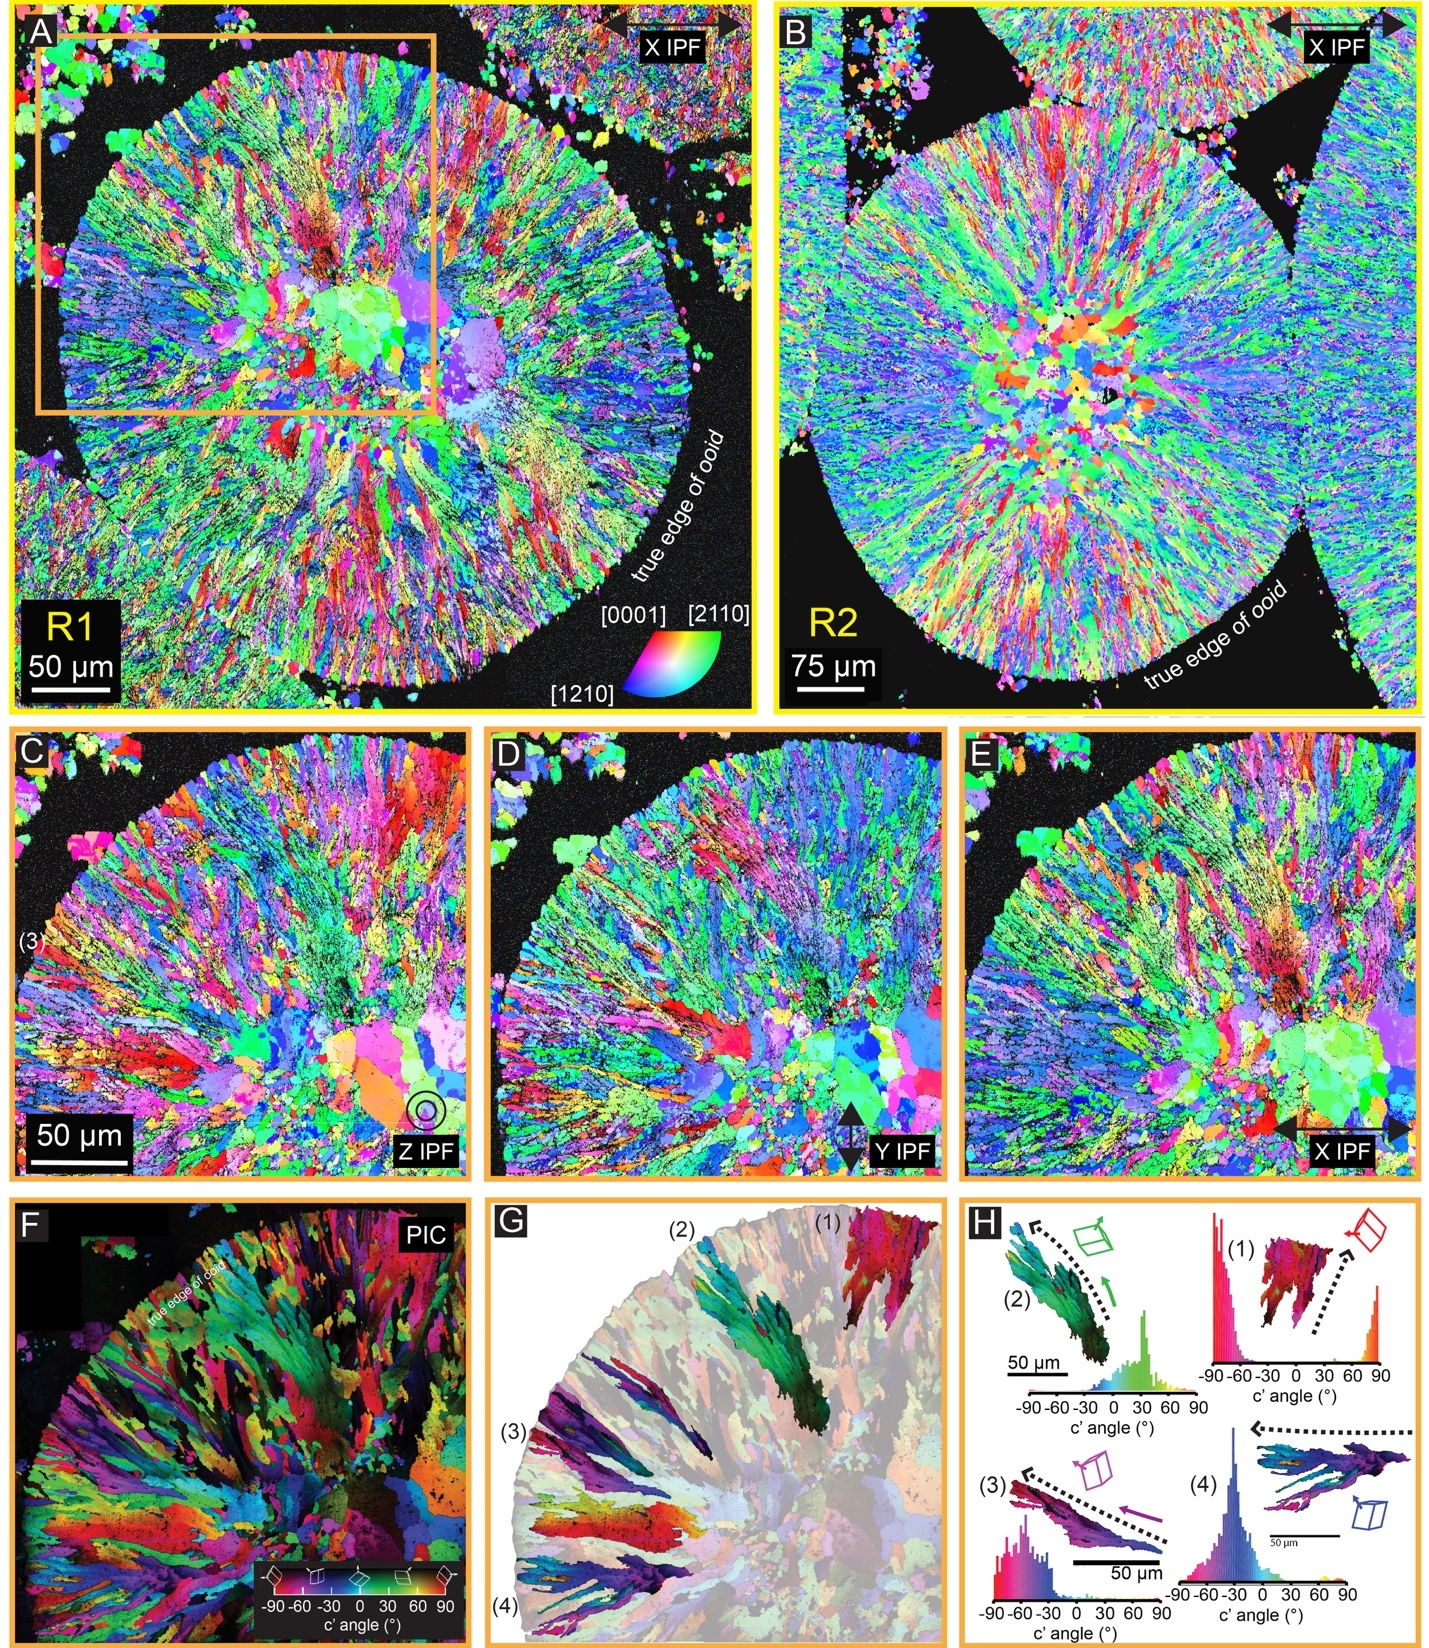
EBSD (Figure 4A-E) and PIC mapping (Figure 4F-H) reveal ooid cortices that are composed of small, fibrous dolomite crystals (∼ 2 μm × 15 μm), while the dolomite crystals in the nuclei are larger and equant. Crystal bundles are composed of radially oriented crystallites with c-axis orientations within 60° of each other (Figure 4G, H). Each bundle exhibits a curved, plumose morphology expanding towards the ooid edges, with systematic brightness and hue changes reflecting progressive c-axis orientation changes consistent with differential growth rates across crystallites within the bundle (Figure 4F, G). All crystals terminate before or at the preserved outer edge of the ooid (labeled in Figure 4A-B).

Comparative crystallographic analysis
For comparison, the stromatolite spherulite sample (SB1_CON) has a dolomite cation ordering ratio of 0.52 with the (104) reflection at 30.94°, while the pisolite sample (SB1_ONC) has a ratio of 0.36 (versus 0.50 for the ooid) and 30.92° for the (104) reflection (Supplemental Figures 16-18). Unlike the ooids, which contain clear banding in the cortices, the stromatolite sample contains no evidence of banding, abrasion, or wave agitation, consistent with spherulites forming in low-energy environments (Figure 2G). The spherulitic stromatolite is cemented by microcrystalline dolomite, whereas the pisolite sample has pores between pisoids filled with multiple generations of fascicular-optic dolomite cements and, occasionally, an orange calcite microcrystalline cement or silica cement (Figure 2K, L). Some of the primary pore structure remains open within the tepee-pisolite complex in the Huqf region.
EBSD analysis of the three samples reveals distinctly different crystal orientations (Figure 5A–F), with the c-axis orientation quantified relative to the crystal elongation direction (Figure 5D–L). This analysis confirms that the ooids have fine, elongated, radial, length-slow crystals, with a mean c-axis-to-elongation angle of 71.5° ± 15.7° (n = 916,647) and preferential a-axis alignment with the elongation direction (Figure 5A, D, G, J). In contrast to the length-slow crystals of the ooid sample, the stromatolite shows length-fast crystal orientations with c-axes oriented parallel to crystal elongation (Figure 5B, E, H, K). This difference is evident in the Y-direction inverse pole figure (IPF) coloring: vertical crystals appear red in the stromatolite (Figure 5B) versus blue and green in the ooid (Figure 5A), indicating c-axes parallel and perpendicular to the Y-direction, respectively. The c-axis to elongation angle histogram shows an approximately uniform distribution in the spherulite (Figure 5K), indicating no preferential crystal orientation. Unlike the fibrous crystal fabric of the ooid sample, the stromatolite spherulite is composed of small, equant to oblong crystals separated by open porosity (Figure 2I), producing a blotchy fabric in both the PIC and EBSD maps (Figure 2H, I).
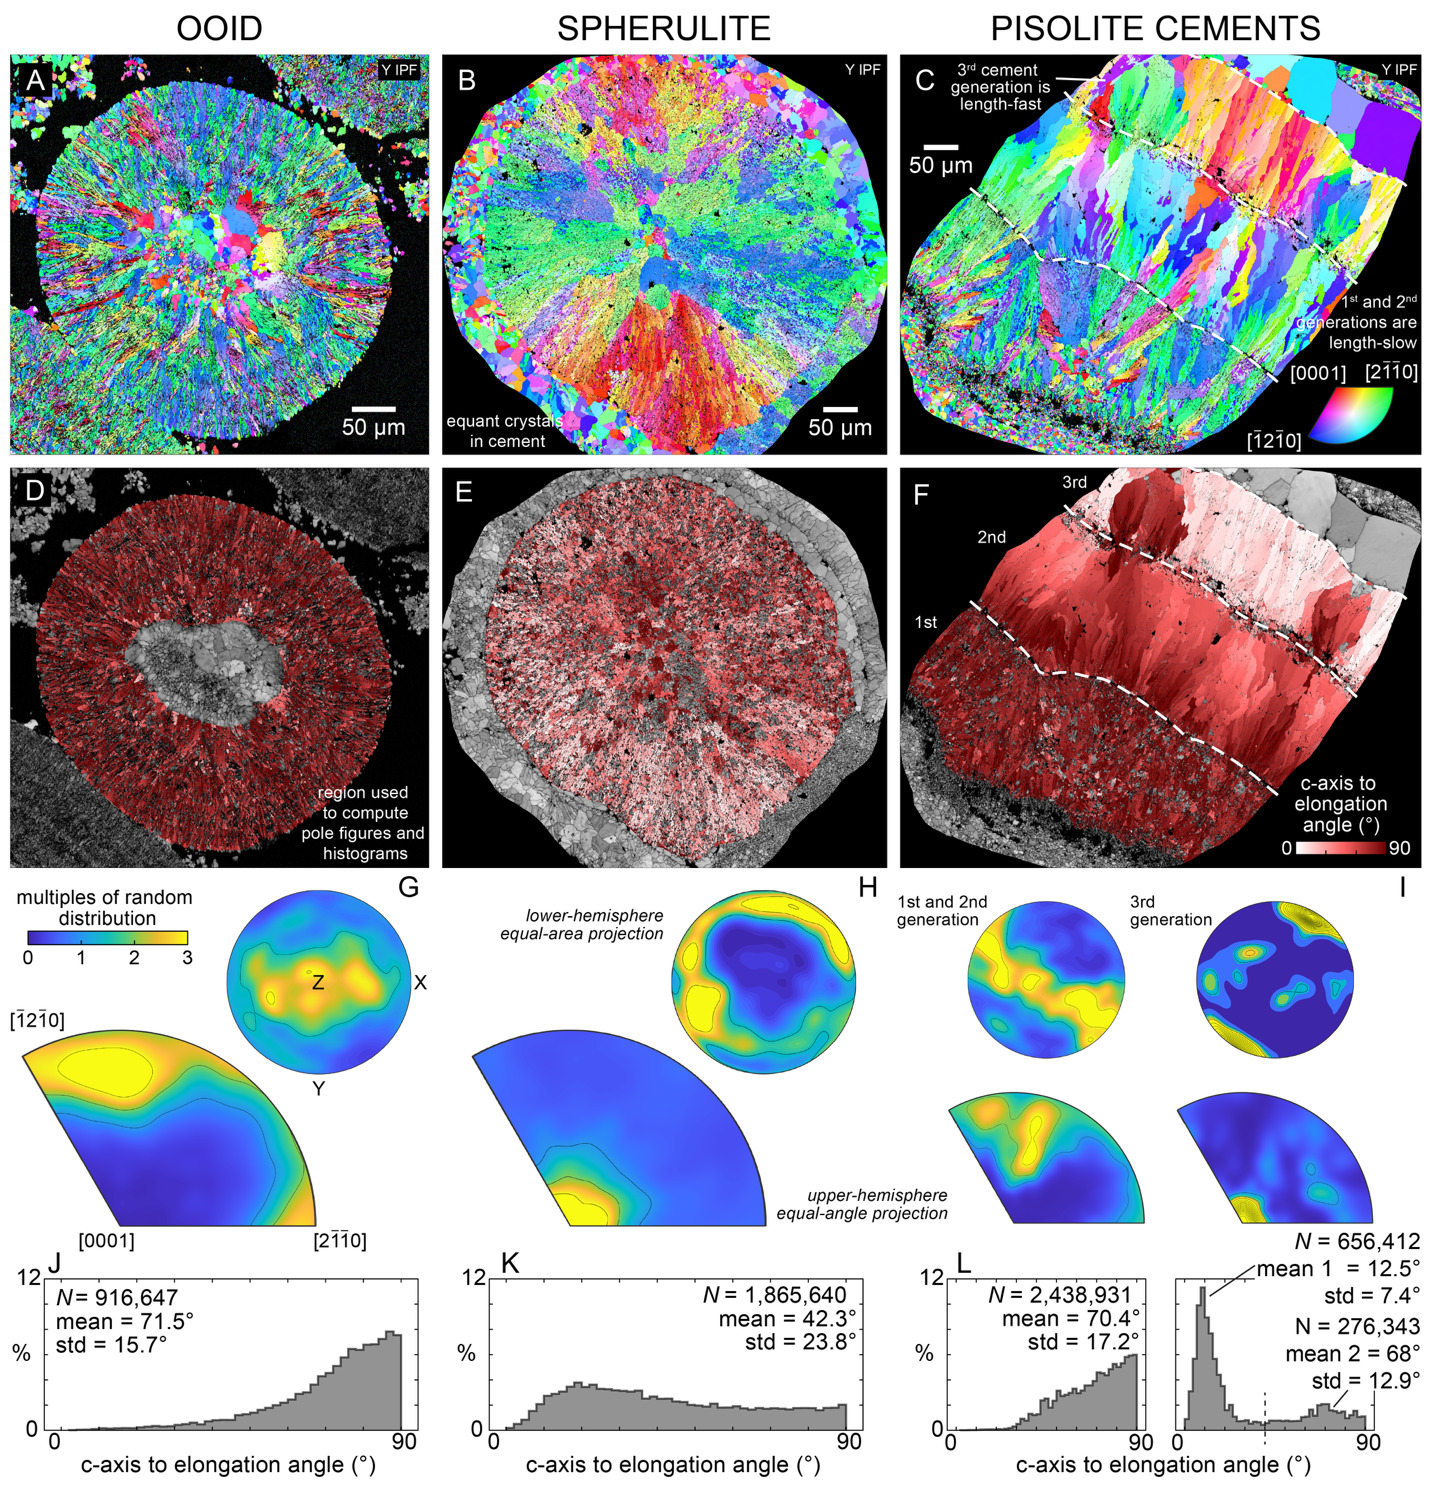
The pisolite sample displays three distinct cement generations. The first- and second-generation cements that nucleate on a pisoid are both length-slow with a-axes parallel to the elongation direction (Figure 5C, F, I, L). The cement crystals transition from smaller bundles near the nucleation surface at the pisoid margin to larger bundles with more consistent orientations moving outward into the original intergranular pore (Figure 5C, F). In contrast to the inner two cement rinds, 70% of crystals in the outer, third generation dolomite cement are length-fast with the c-axis parallel to the crystal elongation direction, with a mean c-axis-to-elongation angle of 12.5° ± 7.4° (n = 656,412) (Figure 5I, L, right), though there are two regions within this outer cement horizon that are length-slow like the first- and second-generation cements. All three cement generations have abundant inclusions.
DISCUSSION
The dolomite composing the ooids of the upper Khufai Formation exhibits exceptional preservation of nanoscale crystallographic details with detectable ordering reflections and a Ca/Mg molar ratio of ~1. The distinctive crystal morphologies and systematic crystallographic orientations contrast with typical modern and ancient ooids, requiring evaluation of alternative formation mechanisms for the Khufai ooids. Comparative analysis with spherulitic stromatolite dolomite and pisolite dolomite cements reveals systematic differences in crystallographic behavior across Ediacaran depositional environments and dolomite fabrics.
Ooid growth dynamics
Ooids form through tangential or radial concentric precipitation of carbonate around a nucleus in environments with high or oscillating energy. Key factors influencing their formation include physical transport and abrasion (Anderson et al., 2020; Harris et al., 2019; Heller et al., 1980; Medwedeff & Wilkinson, 1983; Trower et al., 2017, 2018, 2020), fluid chemistry (Sandberg, 1975, 1983; Wilkinson et al., 1984; Wilkinson & Given, 1986), and microbial activity (Diaz et al., 2015; Diaz & Eberli, 2019; Duguid et al., 2010; Mariotti et al., 2018; Ramey-Lariviere et al., 2023; Riaz et al., 2024). Most modern ooids have a tangential aragonite cortex. Radial aragonite ooids occur in hypersaline environments (e.g. the Great Salt Lake; Sandberg, 1975), and many Phanerozoic calcite ooids are also radial (Anderson et al., 2020; Land et al., 1979; Sandberg, 1983; Wilkinson & Landing, 1978). In both these cases, the ooid cortices are composed of acicular radial crystals, contrasting with the plumose, curved crystal bundles in the Khufai ooid cortices. While few examples have been analyzed with high-resolution techniques, PIC maps of modern tangential aragonite ooids (Frazier, 2024) and EBSD maps of Cretaceous (Dickson, 2023), Triassic (Mono et al., 2025), and Ediacaran (Supplemental Figure 3) (Bergmann et al., 2025) radial calcite ooids consistently show acicular crystals with c-axes parallel to elongation, i.e. a length-fast orientation.
Despite these differences, the Khufai grains display characteristic ooid morphology with a clearly defined nucleus, subspherical-to-elongate shapes, generational crystal growth, and concentric banding (Figure 3A, D, E; Figure 4A; Supplemental Figures 4-8). The Khufai oolite has abundant evidence of wave agitation in a high-energy, shallow marine depositional environment including cross-stratification and intraclasts (Figure 1B). The diverse nuclei (equant dolomite crystals, clotted microbial fabrics, grapestone-like aggregates, and coarse rhombohedral crystals; Figure 3D) all developed similar radial fibrous cortices, suggesting environmental rather than substrate control. Some ooids show cortical spalling and banding (Supplemental Figure 4) inconsistent with low-energy spherulitic precipitates (such as those of the Cretaceous Barra Vehla Formation; Chafetz et al., 2018; Wright & Barnett, 2020), further supporting their classification as ooids rather than spherulites.
The Khufai ooids also record episodic growth. Two distinct cortical generations are present: first-generation crystals with minimal banding, and shorter second-generation crystals with regular banding (Figure 3D, F); the latter is consistent with regular episodes of transport, precipitation, and abrasion (Trower et al., 2020). Subtle Mn variations across concentric bands (Figure 3C) suggest precipitation under fluctuating redox conditions, analogous to other Ediacaran and Ordovician fibrous dolomite cements (Hu et al., 2020, 2022) and more recent calcite ooids (Major et al., 1988). Additional evidence for episodic growth conditions comes from Khufai Dome, kilometers away from Mukhaibah Dome, where fine plumose dolomite crystals alternate with bands of micrite, indicating that conditions capable of producing radial dolomite ooids were widespread (Supplemental Figure 4).
Mimetic dolomitization
Many dolomites form via fluid-buffered replacement of calcite or aragonite, involving Mg-for-Ca substitution of cations within an open-system. This process typically destroys primary fabrics at the intragranular scale and partially to completely at larger scales and creates coarse rhombohedral dolomite crystals (Supplemental Figure 13) (Corsetti et al., 2006; Machel, 2004; Manche & Kaczmarek, 2021; Zempolich & Baker, 1993). The micron-scale preservation of the Khufai ooids rules out this common mechanism. If the Khufai dolomite formed by replacement, it must have proceeded mimetically, preserving primary structures. Mimetic dolomitization is known from Phanerozoic and Precambrian examples, and within the Precambrian is interpreted as a synsedimentary process contemporaneous with deposition and shallow burial (Corsetti et al., 2006; Hood & Wallace, 2012, 2018; Tucker, 1982, 1983).
However, several lines of evidence argue against even mimetic, fabric-preserving dolomitization of the Khufai ooids. First, the degree of crystallographic preservation exceeds what experimental studies show is possible. Zempolich and Baker (1993) demonstrated that replacement dolomitization of aragonite ooids preserves overall shape but destroys primary optical characteristics (a pseudo-uniaxial cross) and creates microcrystalline rhombohedral dolomite (2-8 μm) with coarse rhombohedral dolomite rinds at ooid margins. Similarly, Bullen and Sibley (1984) demonstrated that replacement of skeletal material produces discrete rhombohedral crystals at surfaces exposed to pore spaces. In contrast, the Khufai ooids show space-filling dolomite crystal bundles that terminate precisely at ooid margins, even where no pore-filling cement exists (Figure 2C, D, E; Figure 4), suggesting controlled growth within confined cortical space rather than replacement.
Second, the plumose crystal structure of the ooid cortices shows no inward crystal growth or euhedral rhombs typical of replacement (Figure 2C, D, E; Figure 4). Unlike replacement dolomites that create discrete rhombohedra with intervening porosity from the 10-13% molar volume reduction as Mg2+ substitutes for Ca2+, the Khufai cortices display coherent organization with closely aligned crystal boundaries (Figure 2C, D, E; Figure 4).
Third, stromatolite spherulites within the same succession provide a contrasting example consistent with mimetic replacement where spherulite macrostructure is preserved (Supplemental Figure 9). EBSD shows these spherulites comprise many small oblong and spherical aggregates of dolomite crystals with porosity between crystal aggregates (Figure 2I, J) and irregular orientations that create a blotchy appearance in EBSD, PIC maps, and petrography (Figure 2H, I; Figure 5B). SEM images of the acid-etched spherulites reveal the spheres are composed of even smaller dolomite rhombohedra that coarsen towards the margins, with more porosity—textures typical of replacement (Figure 2J). There is also a clear porosity difference between the spherulites and the large (~10-20 µm) euhedral dolomite crystals in the cement surrounding them (Figure 2I, J; Figure 5B).
The absence of such textures in the cortices of the Khufai ooid makes it improbable that the dolomite crystals are a replacement of calcite or aragonite. The Ca/Mg ratio of the primary precipitate was therefore likely near its current value of ~1. Although a minor amount of Mg may have been incorporated through later sediment-buffered diagenesis, the retained microfabrics are evidence that such Mg-addition must have been minimal. The presence of open porosity, silica cementation, and minimal carbonate cementation (Figure 3) indicates carbonate-poor diagenetic fluids, suggesting little opportunity for dolomitization during burial.
Primary dolomite precipitation
The early generations of pisolite cements in the Birba Formation have features consistent with primary dolomite precipitation. The consistent length-slow, fascicular-optic crystals in early generations are the same features used to argue for primary dolomite cements in other Ediacaran environments including in reef cavities, fractures, and supratidal voids (Hood & Wallace, 2012; Hu et al., 2020, 2022; Stacey et al., 2023; Tucker, 1983). In the pisolite, small, irregularly oriented, curved crystals in the first generation of cement transition to fewer, larger, acicular crystals in the second generation (Figure 2N; Figure 5C, F) as some crystals outcompete their neighbors. This progression mirrors experimental and theoretical models of fibrous cement growth (Bathurst, 1972; Dickson, 1978, 2023; Rodriguez-Navarro & Garcia-Ruiz, 2000), with (i) a nucleation phase at the pisoid surface, (ii) a competitive growth phase where crystals impinge on one another (first generation), and (iii) a parallel growth phase with acicular crystals (second generation). Acid etching confirms the crystals are composed of stacked rhombohedra (Figure 2O). Given the consistent length-slow character, the ~72° offset between the c-axis and elongation direction, stacked rhombohedra, and the observed transition from competitive to parallel crystal growth, these cements likely precipitated with a dolomite crystal lattice and at least partial ordering. In contrast, the third generation is dominated by length-fast parallel dolomite crystals, which we interpret as evidence of replacement of a very high-Mg calcite (VHMC) phase. The change to length-fast dolomite, followed by calcite cement in the pore, indicates fluctuating geochemical conditions typical of pisolite-forming environments (Smith et al., 2021, and references therein).
Several lines of evidence suggest the Khufai ooids also formed through primary precipitation of dolomite rather than replacement of calcite (even VHMC) or aragonite. EBSD analysis of multiple ooids reveals consistent length-slow crystallographic character with the c-axis oriented, on average, ~71.5° from the elongation direction (Figure 5J). This uniformity exceeds that of the replacement dolomite in the spherulite (Figure 5J, K, L). The mean angle is between the 76° angle predicted between the c-axis and elongation direction for the {10̅14} equant rhombohedron or 65° predicted for {01̅12} obtuse rhombohedron (Dickson, 1978, 2023). In contrast, length-slow calcites are rare and usually have low Mg, as described from cave calcites and septarian concretions (Dickson, 1978; Folk & Assereto, 1976; Lindholm, 1974). The Khufai ooid crystals also show preferential a-axis alignment parallel to elongation (Figure 5G). The plumose curvature, unlike the acicular crystals typical of calcite and aragonite ooids (Bergmann et al., 2025; Dickson, 2023; Frazier, 2024; Mono et al., 2025), reflects bundles of crystallites showing slight lattice misalignments (< 60°; Figure 4H). Such curvature and misalignments have been hypothesized to result from crystal splitting and crystallite templating (Kendall, 1985) or from asymmetric growth under extreme supersaturation (Gonzalez et al., 1992), both consistent with synchronous crystallite growth within a bundle rather than later replacement.
Crystal bundles throughout the cortex of the ooid display uniform sizes (~2 μm × 15 μm), morphologies, and orientations, with impinging boundaries (Figure 2C, D, E) that indicate competitive growth similar to the first generation of pisolite cements (c.f. Bathurst, 1972; Dickson, 1978, 2023; Rodriguez-Navarro & Garcia-Ruiz, 2000). Such coherence across thousands of crystals suggests precise growth conditions that would not survive replacement. Today, the ooid’s ordering ratio of 0.5 and Ca/Mg ratio of 1.01 (± 0.01, 1 SE, N =37) is similar to ideal dolomite. The spherulitic stromatolite has a similar ordering ratio (0.51), while the pisolite sample is a bit more poorly ordered (0.39) (Supplemental Figures 16-18). The limited presence of well-formed rhombohedral morphologies in EBSD and acid-etched SEM images (Figure 2C, D, E) supports rapid growth or distinct chemical conditions rather than slow precipitation that can enhance rhombohedral habit and size, as has been shown in a range of studies exploring the various controls on crystal size and morphology (Chen et al., 2023; Gregg et al., 2015; Kim et al., 2023; Malone et al., 1996; Sibley & Gregg, 1987).
Taken together, the coherent length-slow crystallographic orientations, consistently small, curved plumose crystal bundles with similarly oriented crystallites, and Ca/Mg ratio of ~1, along with the evidence that crystal lattice modification and volume reduction are not significant, all support precipitation of a dolomite lattice from the start, even if it was initially imperfectly ordered. While an amorphous Ca-Mg carbonate (ACMC; Rodriguez-Blanco et al., 2015) cannot be ruled out, the evidence for crystal impingement and coherent bundles argues for crystalline rather than amorphous growth. A VHMC precursor is possible but likewise unlikely: it would likely be Ca-rich (Lu et al., 2023; Vasconcelos & McKenzie, 1997), would require substantial lattice reorganization to achieve dolomite ordering, and length-slow VHMC fabrics have not been documented. Thus, primary dolomite precipitation is the most parsimonious interpretation.
Modern analogs and environmental conditions
If the Khufai ooids formed through primary precipitation of dolomite, what environmental conditions would have made this possible? Today, there is extreme kinetic inhibition of dolomite in agitated, open, shallow-marine environments where ooids typically form. This is related to slow nucleation rates, competition with other carbonates, and Mg2+ ions forming strong complexes with water that inhibit their incorporation into carbonate lattices (Arvidson & Mackenzie, 1999; Davis et al., 2000; Gregg et al., 2015; Land, 1998). Today, primary precipitation of dolomite, and even VHMC and amorphous Ca-Mg carbonate, requires extreme environments or microbial processes that disrupt the kinetic barriers (Daye et al., 2019; Diloreto et al., 2021). In hypersaline environments like the Coorong lakes of South Australia or the sabkhas of Qatar, fine (< 1–20 μm), spherulitic dolomite or VHMC precipitates in high-salinity, high-pH, high-aridity settings dominated by sulfate-reducing bacteria (Diloreto et al., 2021; Rivers et al., 2021; Ryan et al., 2020; Wacey et al., 2007). Similarly, Lagoa Vermelha, Brazil, hosts Ca-rich VHMC precipitation under anoxic, hypersaline conditions where bacterial activity plays a critical role; primary carbonate precipitates approach ideal dolomite stoichiometry and become ordered dolomite in the sediment pile (van Lith et al., 2002; Vasconcelos et al., 2005; Vasconcelos & McKenzie, 1997). Experimentally, Na2+, K+, dissolved Si, and elevated Mg/Ca ratios have been shown to increase dolomite precipitation rate and Mg incorporation, likely by disrupting the Mg2+-water complexes (Fang et al., 2021; Fang & Xu, 2022; Hashim et al., 2023; Kaczmarek & Sibley, 2011).
Several lines of geologic evidence suggest that upper Khufai ooids experienced conditions similar to these modern environments that foster dolomite precipitation. Hypersalinity is indicated by evaporite pseudomorphs in underlying mudstones (Osburn et al., 2014) and is a common feature in Ca-Mg carbonate producing environments today (e.g. Ryan et al., 2020; Wacey et al., 2007). Significant microbial influence is evidenced by large domal stromatolites and clotted fabrics within some ooid nuclei (Figure 1B; Figure 3G, H). Silica cementation (Figure 3D) points to elevated dissolved silica, which also may have disrupted Mg2+-water complexes and facilitated dolomite formation (Fang et al., 2021; Fang & Xu, 2022). Authigenic Mg-clay minerals, possibly palygorskite, are concentrated on some ooid nuclei, suggesting at least transient elevated pH (Bergmann et al., 2025), another variable in common with some modern alkaline environments (e.g. Wacey et al., 2007). Dolomite precipitation may have also been aided by elevated temperatures during the Shuram excursion (Bergmann et al., 2025), as is observed in both modern settings (Ryan et al., 2020) and precipitation experiments (Arvidson & Mackenzie, 1999; Hashim et al., 2023; Kaczmarek & Sibley, 2011).
Together, these observations suggest conditions favorable for primary precipitation of partially ordered dolomite, which could have become more ordered with time, proceeding by one of a variety of proposed mechanisms (Kim et al., 2023; Manche & Kaczmarek, 2021; Pina et al., 2020). Once nucleated, precipitation could have continued via the relatively faster kinetics of growth on dolomite seed surfaces, as shown in experiments (Arvidson & Mackenzie, 1999). With abundant Ediacaran syn-sedimentary dolomite grains reworked across sedimentary environments, templating onto a preexisting dolomite lattice may have been even easier.
However, many of these environmental controls were likely common in Precambrian nearshore environments (Hood & Wallace, 2012, 2018; Hu et al., 2020, 2022). Why then are these ooids so unusual compared to most Precambrian dolomite? These ooids formed during the onset of the Shuram excursion, perhaps the largest perturbation to Earth’s carbon cycle, with consequences observed in both marine and terrestrial systems (Bergmann et al., 2025; Busch et al., 2022). This suggests that otherwise familiar environmental parameters may have been amplified during the excursion’s onset, shifting primary dolomite precipitation from cements lining cavities onto grains in the high-energy seafloor setting of ooid shoals. While amplification of the Ediacaran conditions that promoted primary dolomite cements in other environments is the most likely explanation, some yet undefined, time-specific control may have been at play.
Implications for the Shuram excursion
The global occurrence of fibrous, radial dolomitic ooids at the onset of the Shuram excursion represents a previously unrecognized paleoenvironmental signal. These distinctive ooids occur in transgressive settings on multiple paleocontinents: in the upper Khufai oolite of Oman (Bergmann et al., 2025; Osburn et al., 2014), the Johnnie oolite of southern California and Nevada (Bergmann et al., 2011; Corsetti et al., 2006; Hood & Wallace, 2018), and in NW Canada (Busch, 2022). The crystallographic evidence from Khufai ooids—showing evidence for primary dolomite precipitation rather than replacement—suggests these global ooid occurrences reflect unusual seawater conditions that promoted primary dolomite formation in shallow, high-energy environments. While burial alteration has degraded nanoscale fabrics in the Canadian and Californian examples, their preserved macrofabrics are sufficiently similar to the Khufai ooids to suggest a common origin through primary dolomite precipitation. This global pattern suggests that the Shuram excursion began under extraordinary but consistent shallow-marine conditions across multiple paleocontinents around 573 Ma.
The interpretation that the Shuram carbon isotope excursion reflects changes in seawater chemistry rather than later diagenetic alteration (Bergmann et al., 2025), is strengthened by the preservation of systematic crystallographic relationships and absence of typical evidence of replacement dolomitization in this oolite. While the nadir of the Shuram excursion is found in calcitic oolites of the overlying Shuram Formation, the upper Khufai oolite record values as low as –7‰ (Bergmann et al., 2025; Le Guerroué et al., 2006; Osburn, 2013). The exceptional preservation of primary crystallographic fabrics suggests that the isotopic values of these dolomites may reflect their original isotopic composition much more accurately than extensively altered carbonates, though later exchange cannot be excluded even in structurally preserved carbonates (Adams et al., 2023; Cisneros-Lazaro et al., 2022). Recognizing primary shallow-marine dolomite precipitation during this major geochemical perturbation provides new constraints on Ediacaran ocean chemistry and demonstrates the value of nanoscale crystallographic analysis for understanding ancient environmental conditions.
CONCLUSION
High-resolution crystallographic techniques—particularly EBSD combined with PIC mapping—can distinguish between different dolomite formation mechanisms that appear similar in conventional petrographic analysis. Our comparative analysis across three Ediacaran dolomite fabrics reveals systematic differences in crystallographic behavior between ooids, spherulites in a stromatolite, and pisolite cements, indicating that multiple precipitation pathways operated within the same stratigraphic succession. Nanoscale crystallographic analysis of dolomite ooids from the upper Khufai Formation demonstrates exceptional preservation of systematic length-slow crystal orientations, plumose morphologies, uniform crystal sizes, and fibrous bundles that terminate precisely at ooid margins. These properties are not readily explained by existing models of mimetic dolomitization and are distinct from the crystallographic character of calcite and aragonite ooids. Instead, they suggest primary precipitation of crystals with a dolomite lattice, likely imperfectly ordered at nucleation, rather than replacement of calcite or aragonite. Recognizing the possibility of primary shallow marine dolomite precipitation in a high-energy setting during a major global geochemical perturbation suggests rare, but as yet undefined, environmental conditions during an enigmatic interval of Earth history. Outside of the Shuram excursion, this dolomite fabric seems unique in the described literature, although similar nanoscale analysis of other dolomite ooids is warranted. Open-water precipitation of partially ordered dolomite in high-energy ooid shoals may be as distinctive as the Shuram excursion itself.
ACKNOWLEDGEMENTS
Work was supported by Packard Foundation grant to KDB, and DOE grants DE-FG02-07ER15899 and FWP-FP00011135 and NSF grants DMR-1603192 and DMR-2220274 to PUPA Gilbert. We thank C-Y. Sun for assistance during the experiments, and M. Osburn, J. Grotzinger, W. Fischer, C. Ma, and Petroleum Development Oman for initial field and laboratory support. This research used resources of the Advanced Light Source, a U.S. DOE Office of Science User Facility under Contract no. DE-AC02-05CH11231. We thank D. A. Budd, S. Kaczmarek, J. Gregg, B. Wilkinson, A. Maloof, P. Bokulich, and 5 anonymous reviewers for constructive feedback that improved the manuscript.
DATA AVAILABILITY
A subset of results is included in the Supplemental Materials. All analytical data including field photographs, EBSD crystallographic measurements, PIC mapping results, XRD patterns, SEM BSE acid-etched images, EDS elemental maps, EPMA elemental maps and spot analyses, PPL and XPL photomicrographs, stitched photomicrographs, UV fluorescence photomicrographs, and XPL movies supporting this study are available through Zenodo and Github at 10.5281/zenodo.16884822. The dataset includes raw and processed files from all samples analyzed.