INTRODUCTION
The global input of carbon into the ocean is derived from the weathering of carbon-rich rocks, soils, plant debris, and the skeletal remains of organisms, and reaches the deep ocean through sediment transfer systems, including rivers, shore currents, coastal erosion, deltas, aeolian processes, glacial discharge, and ultimately via sediment-gravity flows (Galy et al., 2015; Hage et al., 2022; Hilton & West, 2020; Talling et al., 2024). Of the various pathways that transfer carbon and sediment from coastal margins into the deep ocean, sediment-gravity flows, and turbidity currents in particular represent one of the most effective and direct transfer mechanisms (Azpiroz-Zabala et al., 2017; Baker et al., 2024; Talling et al., 2024). Turbidity currents are fast-moving, sediment-laden flows that are responsible for the vast majority of submarine sediment transport and deposition (Talling et al., 2015). These flows form the world’s largest sediment accumulations and therefore play a key role in the long-term transfer and burial of carbon in the deep ocean (Baker et al., 2024; Baudin et al., 2017; Cartapanis et al., 2018; Cunningham & Arnott, 2023a, 2023b; Hage et al., 2022; Maier et al., 2019; Talling et al., 2024). Quantification of carbon fluxes via turbidity currents is thus necessary for adequate predictions of long-term (i.e., over geological timescales) carbon burial in marine sediments and assessing its effects on climate change, ocean acidification, and deoxygenation (Doney et al., 2009; Siegel et al., 2023).
OC in this study refers to total organic carbon, which originates from organic matter (OM) sourced from the remains of terrestrial plants and marine organisms. In contrast, IC consists primarily of calcium carbonate (CaCO3) derived from carbonate-secreting organisms and weathered rocks, as well as dissolved carbon absorbed from the atmosphere across the air–sea interface (Liu et al., 2022; Middelburg, 2019; Millero, 2007; Ridgwell & Zeebe, 2005). The transport and burial mechanisms differ between OC and IC (Baudin et al., 2010; Masiello, 2007; Middelburg, 2019; Siegel et al., 2023). Rapid burial of OC by turbidity currents can prevent microbial remineralization of OC, thereby removing biologically available carbon from the active cycle (Blair & Aller, 2012; Galy et al., 2007; Middelburg, 2019; Talling et al., 2024). IC burial by turbidity currents is critical because it removes carbonate minerals from undersaturated shallow seawater, reducing dissolution potential and preventing the re-release of recycled CO₂ into the ocean–atmosphere system (DeVries et al., 2012; Keil, 2017). Here, OC and IC refer exclusively to particulate organic carbon and particulate inorganic carbon, as these sediment-associated fractions are transported, deposited, and buried in marine systems (Leithold et al., 2016). The transport of IC and OC by turbidity currents thus preserves carbon in stable sinks and contributes to long-term climate regulation (Archer & Maier-Reimer, 1994; Galvez & Gaillardet, 2012; Ridgwell & Zeebe, 2005).
Carbonate systems are unique in the combined transport of both OC (preserved in OM) and IC retained primarily in carbonate minerals (dominantly CaCO3). The precipitation of CaCO₃ in marine sediments is controlled by a complex interplay of chemical, physical, and biological factors, including pH, total alkalinity, carbonate saturation state, partial pressure of CO2, and biological processes (Millero, 2007; Reijmer, 2021; Ridgwell & Zeebe, 2005). In addition, environmental variables such as light intensity, temperature, nutrient availability, salinity, and ocean circulation strongly influence both carbonate precipitation and mineralogy (James & Clarke, 1997; Lees, 1975; Reijmer, 2021; Schlager, 2000, 2003). While abiotic processes do account for considerable carbonate precipitation (e.g., whitings, Lopez-Gamundi et al., 2025; Macintyre & Reid, 1992; Purkis et al., 2023; Robbins & Blackwelder, 1992; Shinn et al., 1989; hydrothermal carbonates, Coogan & Gillis, 2013; Dekov et al., 2023), marine carbonate formation is preferentially mediated by biological processes (e.g., Middelburg, 2019). Also, given that the modern-day carbonate production in marine environments accounts for approximately 5,700 megatons (Mt) of sediment per year (5.7 Pg/year) (Milliman, 1993; Milliman & Droxler, 1996), which equates to 30-40% of the annual sediment supplied by rivers globally (15,000 to 18,000 Mt/year (15 to 18 Pg/year); Milliman & Farnsworth, 2011; Syvitski et al., 2022), it is imperative to better understand and quantify the transport and burial of both OC and IC in deep-ocean carbonate environments (Nworie, Jobe, Slootman, Venturelli, et al., 2025).
Despite their significance, the transport and burial mechanisms and fluxes of OC and IC within carbonate turbidity currents and deposits remain poorly constrained. While recent studies have revisited estimates of modern terrestrial carbon burial in marine sediments, these contributions predominantly focused on siliciclastic-dominated settings that transport and bury only OC (Baker et al., 2024; Galy et al., 2007; Talling et al., 2024), thereby neglecting the role of IC burial in marine sediments by turbidity currents in carbonate depositional environments. This study addresses that gap by experimentally testing the effect of varying sediment volumetric concentration on the sorting, transport, and deposition of OC and IC in carbonate turbidity currents. Using four flume experiments with increasing sediment concentrations (1.1–11%), we examine how sediment concentration changes in turbidity currents influence (i) vertical and longitudinal OC and IC distributions within the turbidity current flow, (ii) proximal-to-distal carbon (OC and IC) trends in the deposits, and (iii) the relative proportions of OC and IC that are deposited versus bypassed. To place these results in a natural context and evaluate their broader significance, we compare the experimental data with a 25-million-year record of IC and OC burial from the Great Bahama Bank to discuss the implications for global carbon cycling, including burial and storage over geologic time scales. Together, these results allow us to test how sediment concentration, flow behavior, and depositional processes influence the transportation and spatial distribution of carbon in carbonate systems. This study demonstrates that carbonate turbidity currents play a measurable and sustained role in the long-term burial of carbon in the deep ocean.
MATERIALS AND METHODS
Sediment sources and composition
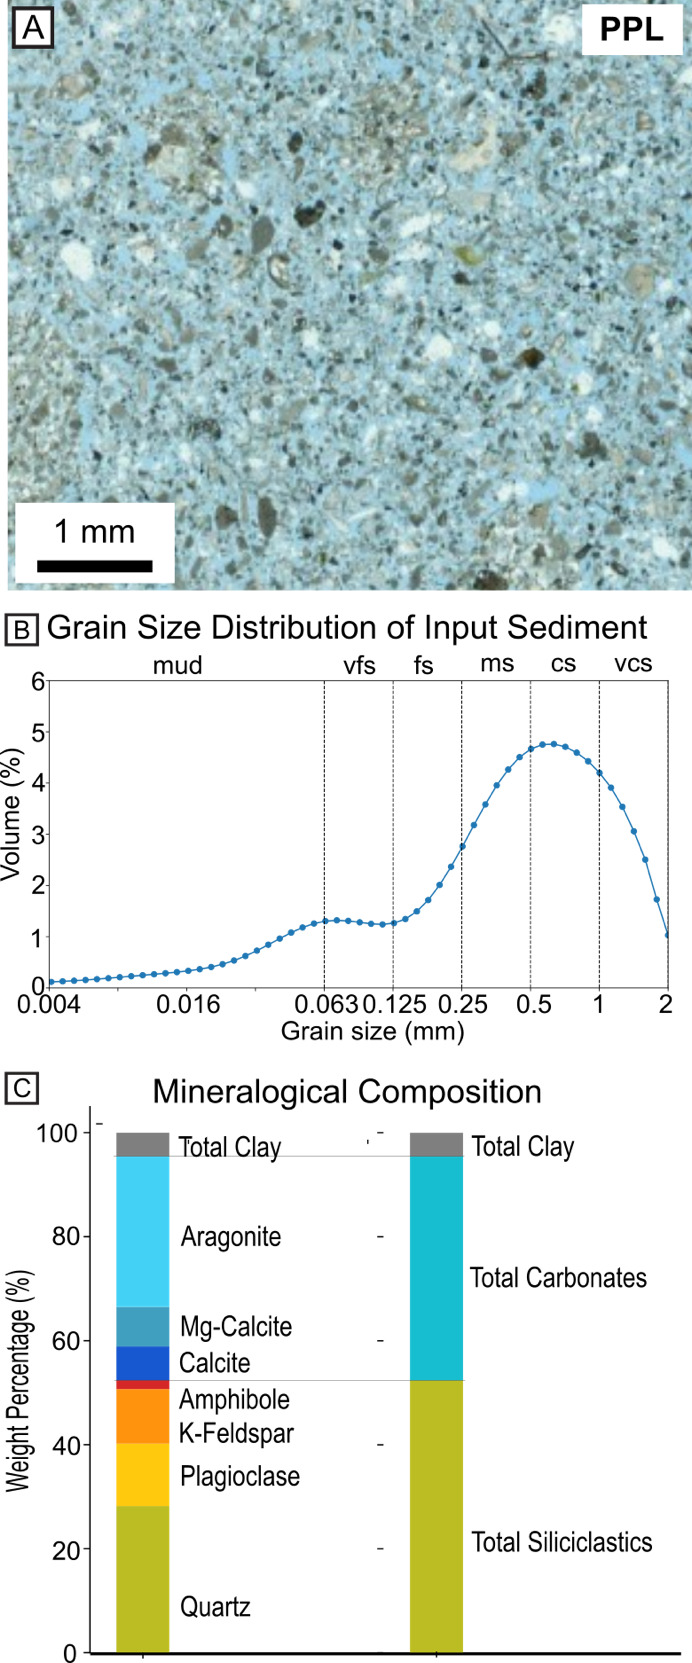
The sediments used in this study are organic-rich mixed carbonate-siliciclastic sediments collected in 2022 from a lagoon located North of Al-Kharj on the western coast of Saudi Arabia. The sediment was stored in sealed containers under cool, dry conditions to minimize oxidation and contamination. The input sediment was composed of 43.1% of carbonate minerals (mostly aragonite), 52.4% of siliciclastic minerals (mostly quartz and feldspars), and 4.5% of clay (Figure 1). Approximately 50% of the sediment is composed of calcareous materials derived from coral reef erosion, skeletal fragments of various marine organisms such as gastropods, bivalves, sponges, and seagrasses (with attached benthic fauna), and carbonate mud (Basaham et al., 2012). In the input sediment, total carbon is 66 ± 1 gC/kg (~6.6%), OC is 11.4 ± 0.7 gC/kg (~1.2%), while IC is 54 ± 1 gC/kg (~5.4%).
_plane-polarized_light_(ppl)_thin-section_photomicrographs_of_the_deposit_from_the_3.6_.png)
The grain-size distribution of the input sediment was analyzed using laser diffraction with a Malvern Mastersizer 2000, equipped with a Hydro 2000G sediment introduction unit. The measurements showed D10, D50, and D90 values of 47 μm, 424 μm, and 1193 μm (Figure 1B). Additionally, ≤5% of the sediment exceeded the upper measurement limit of 2 mm of the laser diffraction method used for grain-size analysis. The dry bulk-specific sediment density was determined to be 2,340 kg/m³. This value was obtained by measuring the dry mass of 0.001 m³ (1 L) of sediment oven-dried at 50°C. The bulk density (kg/m³) was calculated as the ratio of the dry mass to the known sediment volume, with the porosity of ~40% accounted for.
Experimental setup and procedure
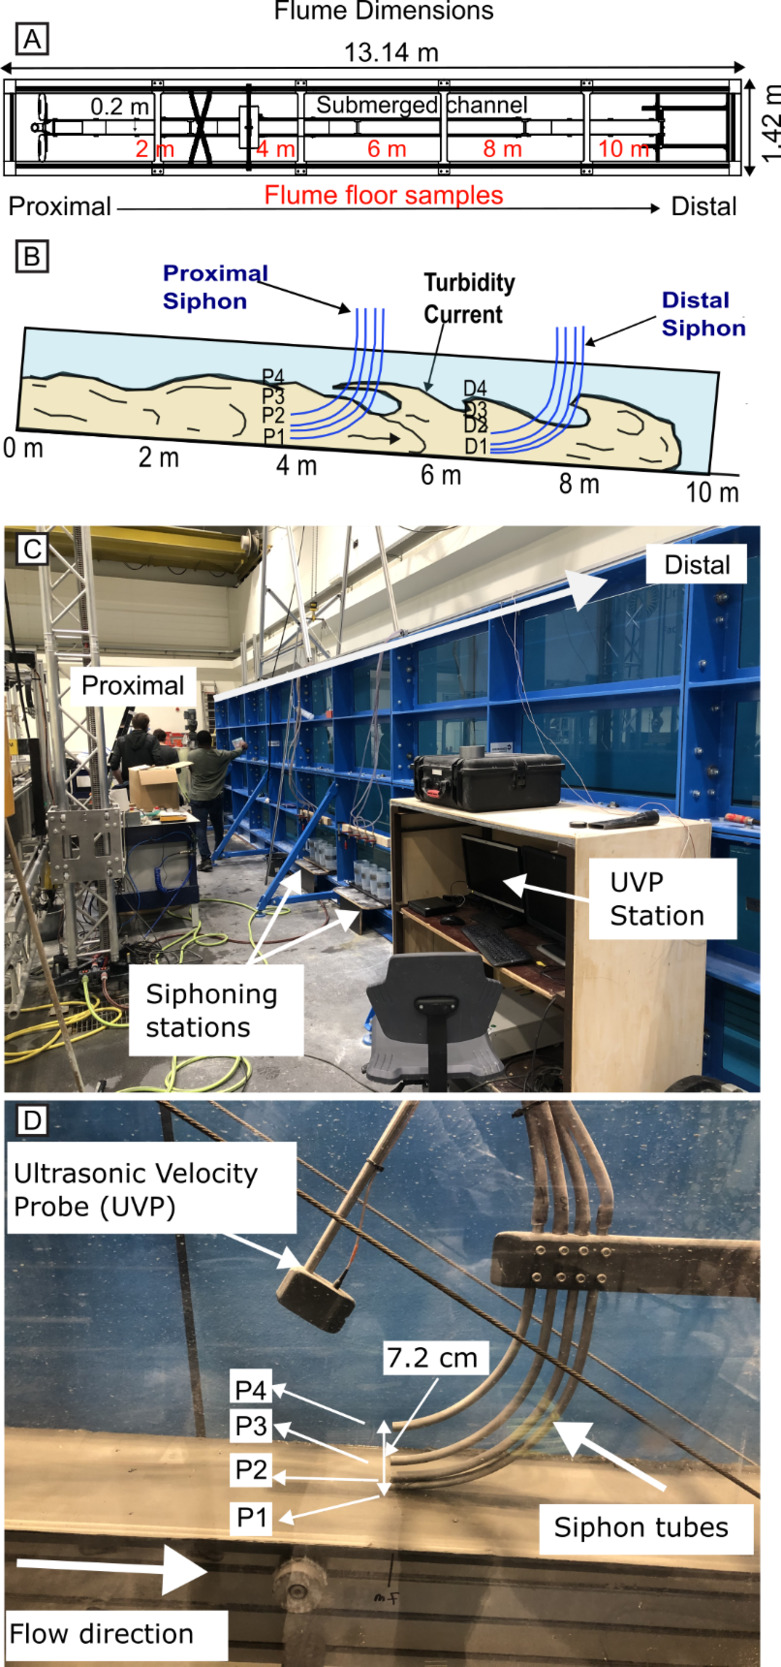
The experiments were conducted in an 11 m × 0.6 m × 0.2 m (length × height × width) turbidity current channel, which was completely submerged in a larger 13.14 m × 2.30 m × 1.42 m tank filled with fresh water at the Earth Simulation Laboratory at Utrecht University, The Netherlands (Figure 2). The initial 0.6 m of the channel was fitted with a diffuser to ensure a lateral well-spread current rather than a concentrated jet. The turbidity current was produced by mixing the required volume of input sediment into a 0.25 m3 mixing tank filled with fresh water. To ensure sediment stayed in suspension, the vigorously stirred mixture was continuously recirculated into the tank using an external mixing pump for about 5 minutes prior to release of the mixture into the channel. The experiment series consists of four runs carried out with the input sediment with sediment volumetric concentrations of 1.1%, 3.5%, 5.6%, and 11%. Sediment concentration here refers to the volume fraction of solid grains in the mixture (excluding porosity between the sediment grains) relative to the total volume. The flume conditions in the submerged channel remained constant across all flows, with a fixed inlet discharge and a fixed 4° slope. Vertical profiles of flow velocity were measured using ultrasonic velocity probes, and sediment concentration was determined using siphon tubes at proximal (4 m) and distal (7 m) locations (Figure 2B).
_plan_view_and_(b)_side_view_diagrams__and_(c)_photo._(d)_photo.png)
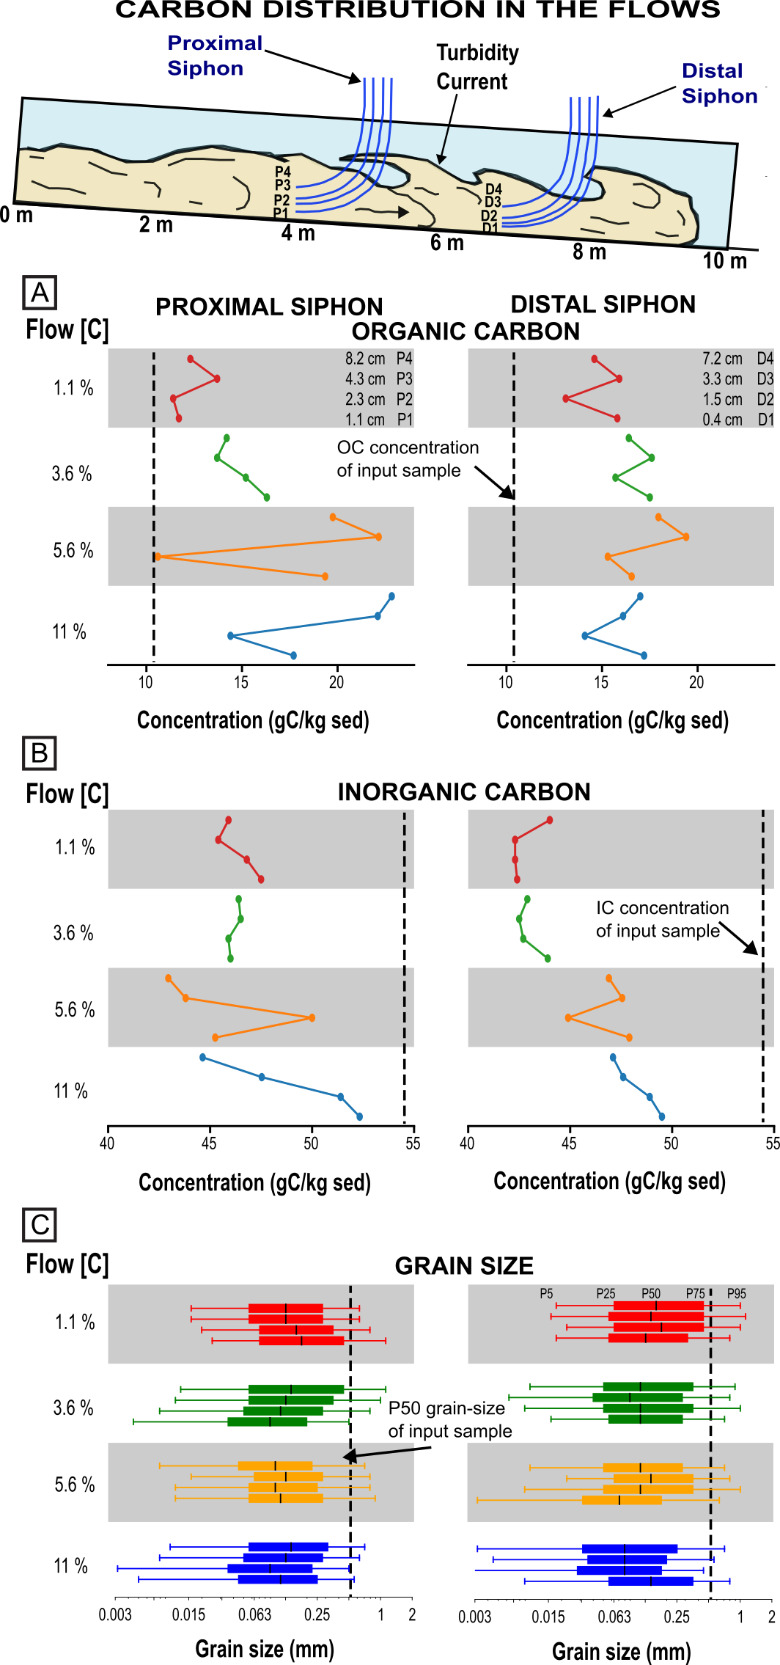
Samples were collected along the flume floor at 2 m, 4 m, 6 m, 8 m, and 10 m distances from the flume inlet by using a scraper that retrieved the bulk sediments across the entire width of the experimental deposits (Figure 2A). The siphons have an inner and outer diameter of 7.25 mm and 10 mm. The proximal siphons are numbered P1-P4 from the bottom upwards with the siphons placed at a vertical distance of 1.1 cm, 2.3 cm, 4.3 cm, and 8.2 cm from the bed. The distal siphons are named D1-D4, positioned at 0.4 cm, 1.5 cm, 3.3 cm, and 7.2 cm from the bed. Collection of siphon samples commenced immediately once the current reached the siphon location and continued until ca. 1 liter was collected from each siphon. The siphon samples were analyzed to determine the volumetric sediment and carbon amounts, as well as grain-size distributions (GSD) at each siphon level and location. GSD of the siphon samples and final deposits were measured with a Malvern Mastersizer 2000 laser diffractometer equipped with a Hydro 2000G dispersion unit. The siphon and deposit sampling design captures proximal–distal and vertical variability in suspended and deposited sediment, making the samples broadly representative of transport dynamics at the time and position of collection. However, these discrete measurements cannot resolve full temporal heterogeneity, and the reported OC/IC contents should be interpreted within this constraint. All experiments were conducted with a 4° slope of the flume floor, which was calibrated to ensure that both bypass and deposition occurred, mimicking conditions found in most natural submarine slope-basin systems.
Carbon analysis
Sediment samples were dried for one day at 65°C and subsequently ground to ensure uniformity and achieve a fine particle size as required for total carbon analysis. Two parts of the same sample were then weighed in a crucible with a nickel inlay. The first part of the sample was left untreated, while the second part was gradually heated in a muffle furnace to 550°C, a step intended to remove the organic carbon concentration. After cooling, both parts of the sample were analyzed using a LECO SC632 instrument to measure carbon concentration. More information on LECO SC632 organic geochemical analysis procedures is described by Carvajal-Ortiz et al. (2021). The first part of the sample, which had not undergone preheating, was analyzed to determine the total carbon concentration. The second part, preheated to remove OC, was analyzed to measure the IC concentration. Finally, the OC amounts in the sample were calculated by subtracting the IC concentration (from the preheated sample) from the total carbon content (TC) (from the original sample) (%OC = %TC – %IC). To check the results for quality, the method was also applied to four standard samples. The 502-694 standard (10.8% C) was consistently reproduced within 10.7-10.9% C. Four sub-samples of the input sediment were analyzed separately to determine the OC concentration, which was used to obtain the average OC in the input sediment. The OC (%) and IC concentration (%) were converted to gC/kg of sediment by multiplying by 10. Carbon measurements by LECO SC632 have a precision of ca. ±0.1% C. Replicate input-sediment analyses varied by ~0.06%, so the reported average OC (1.15%) is accurate within ±0.1% (i.e., ±1 gC/kg sediment).
Sediment, OC, and IC deposited and bypassed calculations
To quantify the partitioning of sediment, OC, and IC between deposition and bypass, we first determined the total input volumes of sediment, OC, and IC based on the composition of the input mixture. The volume of sediment deposited in each experiment was estimated by measuring deposit thickness at multiple points along the flume (2 m, 4 m, 6 m, 8 m, and 10 m). Each interval between measurement points was treated as a separate segment for sediment volume calculation. We assumed that the deposit thickness is laterally uniform across the flume width. Using the measured thicknesses, flume width, and segment length, the bulk sediment volume was computed by multiplying the flume width by the segment area, which was estimated using the trapezoidal numerical integration (TrapZ) (Whittaker & Robinson, 1967) method in Python. The sediment volume was then converted to mass (kg) by multiplying by the dry bulk density (1,623 kg/m³), which accounts for porosity of ~40%. The corresponding masses of OC and IC at each segment were calculated by multiplying the measured OC% and IC% at each location by the segment’s sediment mass. The total deposited masses of sediment, OC, and IC were obtained by summing their respective segment masses along the entire flume length. The bypassed masses of sediment, OC, and IC were then estimated by subtracting the deposited masses from their respective input totals.
Bahamas data compilation and modeling
Bahamas carbon burial-flux quantification
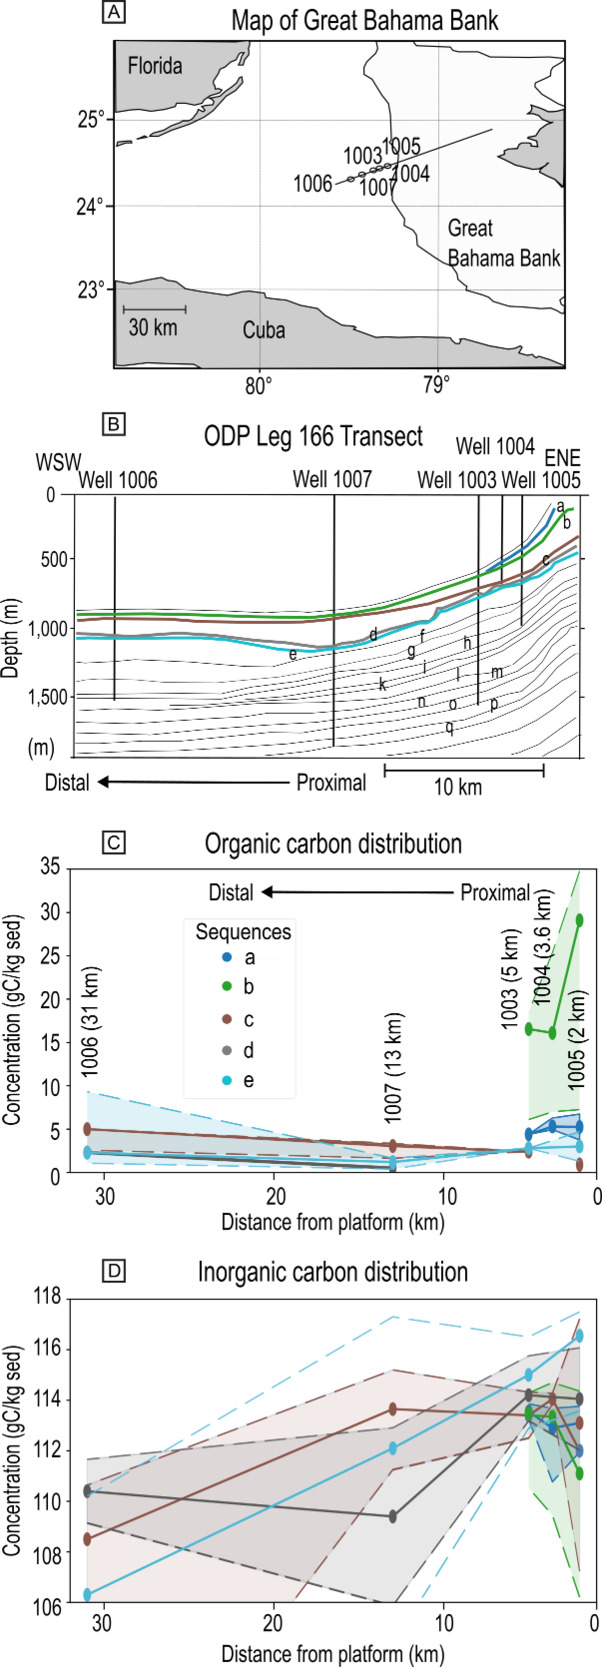
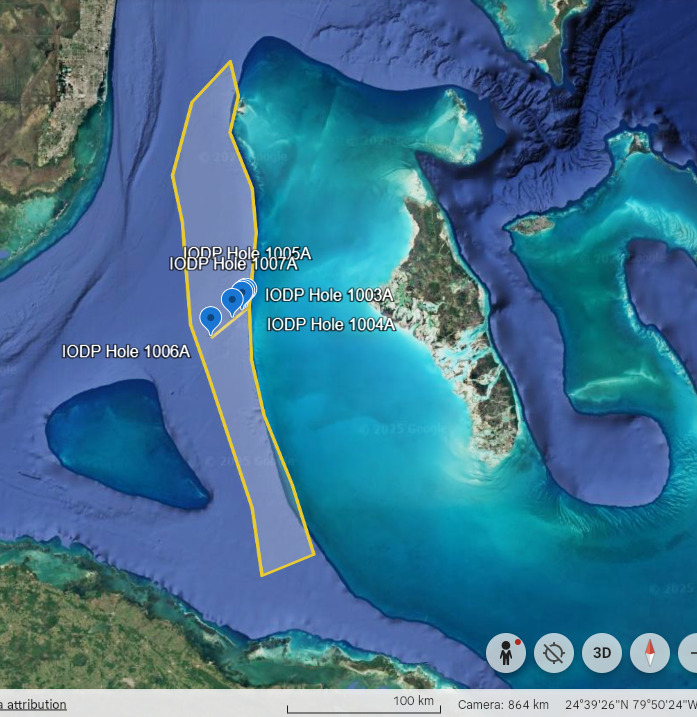
Ocean Drilling Program (ODP) Leg 166 drilled a margin-to-basin transect across the western Great Bahama Bank (GBB) to investigate Neogene-Quaternary sea-level change and fluid flow (Eberli et al., 1997; Swart et al., 2000; Wunsch et al., 2000). The transect recovered a 25- to 30-million-year stratigraphic record comprising at least 17 seismic–stratigraphic sequences (labeled A to Q) that span the late Oligocene through the Holocene (Eberli et al., 1997; Swart et al., 2000). These sequences document repeated cycles of off-bank transport that built a thick wedge of progradational carbonate deposits along the slope (Betzler et al., 1999; Eberli et al., 1997). Cores from five wells 1003 to 1007, along the slope transect, provide a rare longitudinal dataset for evaluating how successive sediment-export events delivered both OC and IC into the slope-to-basin system.
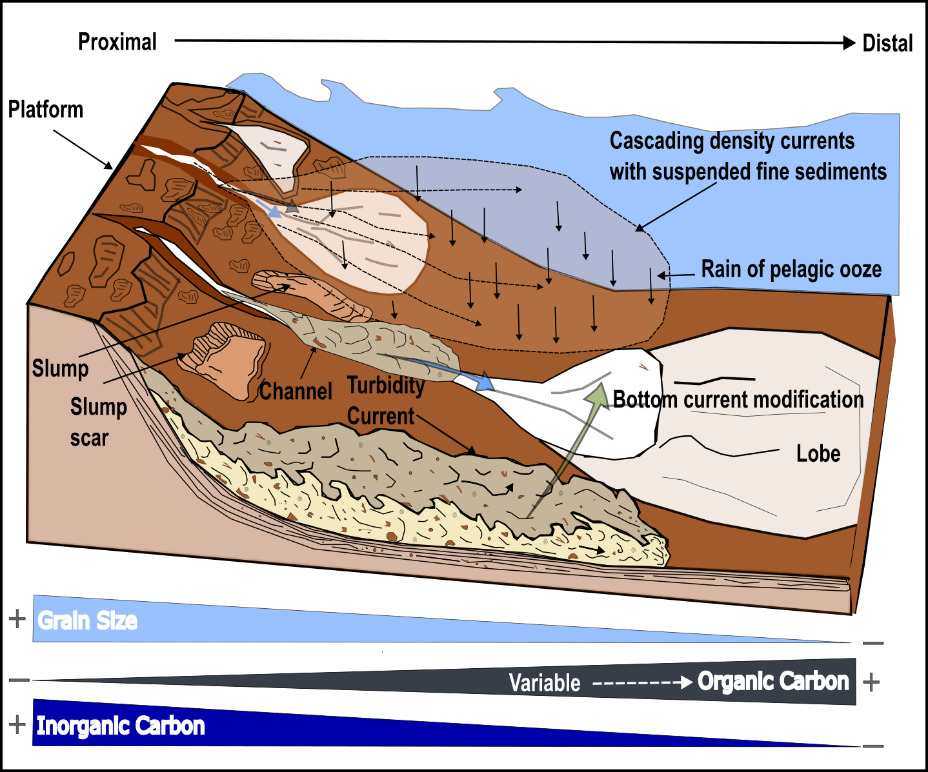
The GBB is a flat-topped carbonate platform that spans over 100,000 km2 west of the Bahamas. The western edge of the GBB forms a 2° to 8° slope covering more than 11,000 km2, with ca. 600 m of relief away from the initial steep platform edge, which is characterized by channels, sediment waves, and density-driven deposits (Betzler et al., 2014; Principaud et al., 2016; Wunsch et al., 2018).
We acknowledge that because the GBB slope is impacted by multiple depositional processes in addition to turbidity currents (e.g., cascading density currents, bottom-current winnowing) (Bernet et al., 2000; Droxler & Schlager, 1985; Eberli et al., 1997; Eberli & Betzler, 2019; Lopez-Gamundi et al., 2024; Mulder et al., 2019; Schlager et al., 1994; Wunsch et al., 2018), the estimates of IC and OC flux may be imperfect. These other depositional processes can rework previously deposited sediments and/or introduce secondary material, potentially altering the carbon signal and obscuring the contribution derived solely from turbidity currents. However, the GBB transect still represents the most complete proximal-to-distal transect available for a modern carbonate slope (Busson et al., 2019; Eberli et al., 1997).
The OC and IC concentrations were originally measured in the Leg 166 cores by the shipboard scientific party and subsequent studies (e.g., Eberli et al., 1997; Swart et al., 2000). ODP Leg 166’s TC, OC, and IC were determined using a Carlo Erba 1500 NCS Analyzer and a Coulometrics NA5011 CO₂ coulometer (Emeis & Brown, 1989; Emeis & Kvenvolden, 1986). OC was calculated as the difference between TC measured by the Carlo Erba 1500 NCS Analyzer and IC determined using a Coulometrics NA5011 carbon-dioxide coulometer. The analytical precision of IC measurements was approximately ±2% (Eberli et al., 1997). These TC–IC difference methods are assumed to be directly comparable to those applied in this study, allowing consistent evaluation of OC and IC concentrations between the ODP and flume datasets. Detailed organic geochemical analysis procedures are described by Emeis and Kvenvolden (1986).
In order to calculate carbon burial flux, the volume of sediment was first estimated using the area and thickness of the deposits. The minimum, median, and maximum deposit thickness were derived from the entire sequences in the cross-sections of the five wells (1003 to 1007)(Eberli et al., 1997), assumed to be representative for volume quantification. The area was computed using maps from Principaud et al. (2016) and validated by the authors using Google Earth (Supplementary Figure 1) and was used for all cases. The bulk sediment volume was calculated using the thickness and area estimates, and these volumes were converted to sediment mass using median dry bulk density of 1,838 kg/m³ (dry density ranged from 1308 to 2588 kg/m³ across the five wells), which accounts for porosity that varied with depth from 14% to 68% (with an average of ca. 55%) as a result of differential compaction (Eberli et al., 1997). The dry bulk density and porosity of the sample were calculated by the dry pycnometer volume method (Eberli et al., 1997).
Minimum, maximum, and median OC% and IC% were compiled for all five wells, and the OC and IC mass contributions were obtained by multiplying the sediment mass by their respective median OC% and IC% values. To capture uncertainty, we considered the full range and median of reported values in sediment thickness, bulk density, and OC/IC values across the five wells. Minimum and maximum values for each parameter (sediment thickness, bulk density, and OC/IC) were used to calculate lower, mid, and upper bounds of carbon flux and burial estimates, providing a more robust representation of variability within the dataset. Finally, the total carbon mass was normalized by the time interval (spanning 5 to 25 million years) represented in the deposits to derive annual burial flux estimates (Table 1). This temporal range (5 to 25 million years) is constrained by the stratigraphic coverage of the ODP Leg 166 slope wells, which varies significantly along the transect. Core lengths range from ~200 to 1300 m (Eberli et al., 1997), with Well 1007 spanning the full sequence interval, whereas other wells recover only subsets of these sequences. As a result, OC% and IC% values are derived from intervals that do not uniformly represent the full temporal range at every location, but likely collectively capture variability across the slope-to-basin system. The 200–1300 m range, therefore, represents the composite depth window across all wells and is assumed to approximate sedimentation rates for the analyzed intervals (Eberli et al., 1997).
To avoid ambiguity in the timescales analyzed, we distinguish between two components of the study. First, carbon burial flux calculations use a broad temporal range of 5 to 25 million years, based on deposit thicknesses and time intervals derived from ODP Leg 166 stratigraphy. Second, the Bahama longitudinal trends focus specifically on the youngest five sequences (A-E), which record the last ~5.4 million years, from the late Pliocene through the Pleistocene (Eberli et al., 1997; Wunsch et al., 2000). This subset was selected to provide a consistent and internally comparable framework for examining proximal-to-distal patterns. Variability across the slope within this younger sequence interval (A, B, C, D, and E) was quantified by analyzing OC and IC distributions (P5, median, P95) in wells 1003-1007 from only non-zero measurements. P5 and P95 represent the 5th and 95th percentiles of the distribution.
RESULTS
Experimental carbonate turbidity currents
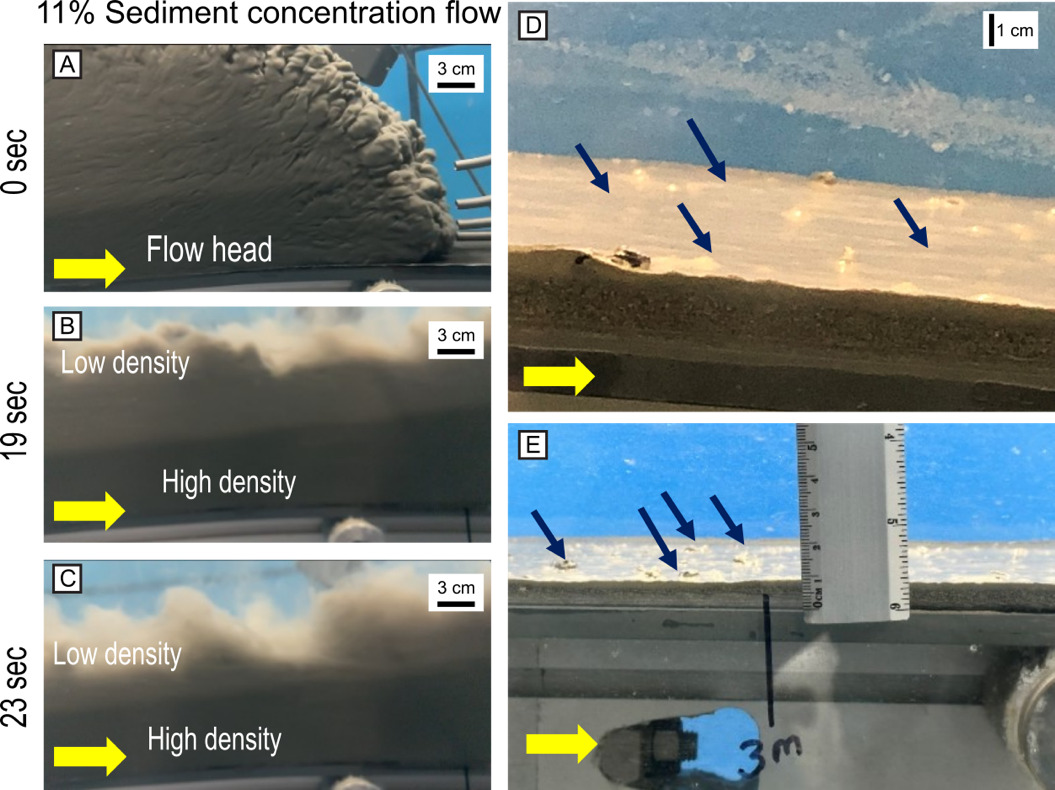
The carbonate turbidity-current experiments investigated the effects of variable sediment concentrations on flow behavior, sediment transport, and deposit characteristics. Each flow lasted approximately 1 to 2 minutes. Sediment concentration decreased along the flume for all flows as a result of sediment deposition and vertical flow expansion caused by flow deceleration downstream. All experiments produced turbidity currents that evolved through distinct head, body, and tail stages (sensu Kneller & Buckee, 2000), with flow morphology and internal organization varying systematically with initial sediment concentration (11%, 5.6%, 3.6%, and 1.1%). High-concentration flows (11% and 5.6%) developed compact, coherent heads with dense frontal noses, followed by bodies and tails that each maintained a relatively uniform flow thickness (5-19 cm) and well-defined vertical stratification. These flows displayed clear turbulent features, including backward-rotating eddies and Kelvin–Helmholtz instabilities at the flow front (e.g., Baker et al., 2017). In contrast, lower-concentration flows (3.6% and 1.1%) produced more diffuse, vertically expanded heads (>20 cm) and bodies and tails characterized by weaker vertical contrasts, reduced coherence, and more rapid thinning during the terminal tail stage. Flow stratification strengthened progressively with increasing sediment concentration, with a dense basal layer developing beneath a dilute upper layer from 3.6% upward (Figure 3) (cf. Baker et al., 2017; Cartigny et al., 2013; Nworie, Jobe, Slootman, Eggenhuisen, et al., 2025).

Velocity measurements reveal systematic reductions in magnitude with decreasing sediment concentration and increasing distance downstream (Nworie, Jobe, Slootman, Eggenhuisen, et al., 2025). Time-averaged vertical profiles of flow velocity show near-bed maxima occurring within the lower ~10% of the flow thickness, with higher concentration flows (5.6% and 11%) exhibiting significantly higher near-bed velocities (0.15-0.39 m/s) than lower-concentration flows (3.6% and 1.1%), which reached maximum values of ~0.07–0.15 m/s. Downstream attenuation reduced maximum velocities by ~20–50%, and increased head arrival lag times with decreasing initial sediment concentration, from 8.2 s in the 11% flow to 19.0 s in the 1.1% flow, while overall velocity profile shapes remained consistent across flow stages. Here, lag time is defined as the difference between the flow head’s arrival times at the proximal and distal UVP locations.
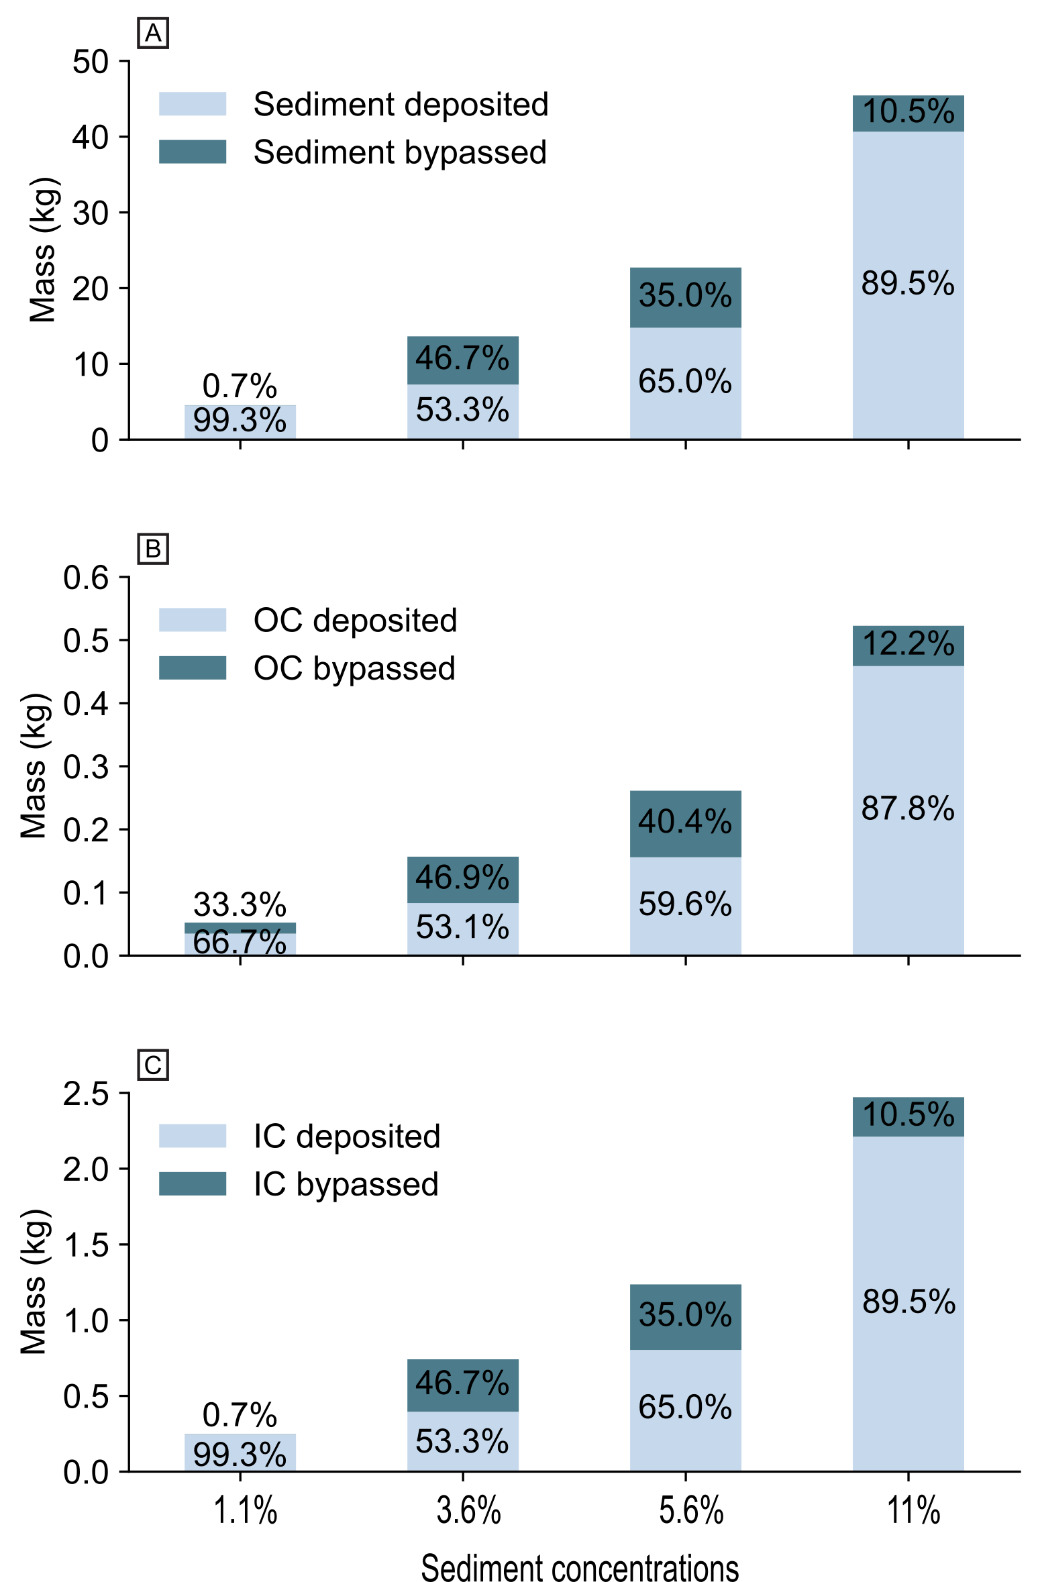
Siphon samples collected at the proximal (4 m) and distal (7 m) locations provide direct quantitative constraints on the vertical and longitudinal distribution of sediment concentration within the turbidity currents. Siphon samples show that sediment concentration decreased vertically upwards through the flow at any given position along the flume (Nworie, Jobe, Slootman, Eggenhuisen, et al., 2025). For example, in the 11% concentration flow, the sediment volumetric concentration at the proximal siphon location decreased upwards from 4.7% to 1.8% over a vertical distance of about 8 cm, and from 3.5% to 1.4% at the distal siphon location, following an approximately exponential decline with the steepest gradients confined to the lower ~45–50% of the flow thickness. This vertical structure reflects strong near-bed sediment enrichment in higher-concentration flows (11% and 5.6%), where concentrations decreased sharply from ~2.0–4.7% at 1–2 cm above the bed to ~0.6–1.8% at ~8 cm above the bed, whereas lower-concentration flows (3.6% and 1.1%) exhibited more gradual vertical decreases, with near-bed concentrations of ~0.25–0.32% declining modestly to ~0.18–0.24% at ~8 cm above the bed. Direct visual observations indicate that both suspended and bed-load transport occurred in all flows; however, sediment movement became increasingly concentrated near the bed in higher-concentration runs, reflecting a greater contribution from bed-load transport. Longitudinally, suspended-sediment concentration decreased systematically from the proximal (4 m) to distal (7 m) station at all siphon heights, with the largest reductions occurring in the 11% flow, where total suspended concentrations were reduced by approximately half. Lower-concentration flows deposited a greater proportion of their sediment load upstream of the distal measurement station, with the 1.1% flow depositing ~99% of the sediment and bypassing ~1%. In contrast, intermediate-concentration flows showed substantially higher bypass, with ~47% bypassed in the 3.6% flow and ~35% bypassed in the 5.6% flow, whereas the highest-concentration flow (11%) exhibited comparatively limited bypass of ~10% (Figure 4A).
_acros.png)
Flows with higher sediment concentrations generated thicker deposits, reaching approximately 148 mm near the inlet (in the deposit from the 11% flow) and gradually thinning to less than 1 mm at 10 m downstream. The 5.6% and 3.6% flows deposited ca. 10 mm and ca. 7 mm near the inlet, thinning to <1 mm by 10 m, while the 1.1% flows deposited only ca. 3 to 4 mm that thinned to <1 mm within 5 m. The experiment deposits present an overall fining upward trend with the coarsest grains deposited at the base of the deposit and near the inlet, which is evident with the formation of the mud cap at the top of the deposit (Figure 3D).
Distribution of OC, IC, and grain-size within carbonate turbidity currents
The vertical distribution of IC and OC within flows was measured from the sediment samples obtained by siphoning at different heights at proximal and distal locations in the flume (Figure 5). Measured OC concentration in suspended flow samples was higher than that in the bulk input sediment, suggesting suspension transport of fine, organic-rich fractions. In contrast, IC concentration in the suspended flow samples was consistently lower than in the input sediment, suggesting more proximal deposition and bedload transport (Figure 5).
_organic_carbon_(oc)_and_(b)_inorganic_carbon_(ic)_in_grams_of_carbon_.png)
OC concentration shows variable vertical and spatial patterns that depend on flow concentration and position along the flume (Figure 5A). In the 11% flow, OC concentration initially decreases from ~17.7 gC/kg at P1 to ~14.4 gC/kg at P2, then increases upward from P2 to ~22.8 gC/kg at the top (P4) in the proximal siphons. The distal siphon follow similar pattern with concentration values spanning from ~14.2 gC/kg to ~17 gC/kg. The 5.6% flow exhibits OC values of ~10.6 gC/kg to 22.2 gC/kg proximally and ~15.3 gC/kg to 18.0 gC/kg distally, with a decrease from P1 to P2 followed by an increase toward mid-depth (P3) and a slight decline near the top (P4). Lower-concentration flows show reduced magnitudes and narrower ranges: the 3.6% flow spans ~13.7 gC/kg to 17.6 gC/kg proximally and ~15.7 gC/kg to 17.5 gC/kg distally, while the 1.1% flow ranges from ~11.4 gC/kg to 13.7 gC/kg proximally and ~13.1 gC/kg to 15.9 gC/kg distally. In the 3.6% flow, OC decreases slightly in the lower part of the proximal profile before increasing toward the top, whereas the distal siphons show a pattern like that of the 5.6% flow. The 1.1% flow follows a comparable trend to the 5.6% flow, with an initial decrease from P1 to P2, followed by an increase and a slight decline near the top. Overall, the 11% and 5.6% flows have higher OC concentration and larger vertical variability in the proximal siphons (ranges of ~14 gC/kg to 23 gC/kg for 11% and ~10 gC/kg to 22 gC/kg for 5.6%) compared to the distal siphons (~14 gC/kg to 17 gC/kg and ~15 gC/kg to 19 gC/kg, respectively), while in the 3.6% and 1.1% flows, OC magnitudes are lower proximally (~14 gC/kg to 16 gC/kg and ~11 gC/kg to 14 gC/kg) than distally (~16 gC/kg to 18 gC/kg and ~13 gC/kg to 16 gC/kg respectively), with narrower vertical ranges (generally <3–4 gC/kg). It is important to note that the siphon depths sampled only the lower 8 cm of the flow, thereby overrepresenting the high-concentration interval rather than the entire flow height, especially in the flow head whose flow height exceeds that of the siphon (Figure 3).
IC concentration in the suspended flow samples also exhibits complicated vertical and spatial variation across the runs (Figure 5B). In the 11% flow, IC consistently decreases upward from the base to the top in both proximal (~52.3 gC/kg at P1 to ~44.6 gC/kg at P4) and distal (~47.1 gC/kg to 49.5 gC/kg) siphons. The 5.6% flow shows a slight increase from P1 (45.25 gC/kg) to P2 (50 gC/kg), followed by an upward decrease of ~3.1 gC/kg. The distal siphons in the 5.6% flow, however, show the inverse pattern, with a minor decrease from D1 to D2 (from ~47.9 gC/kg to ~44.9 gC/kg) and a subsequent increase at P3 (47.3 gC/kg) before slightly declining again at the top (46.9 gC/kg). The 3.6% flow shows limited vertical variability, with an upward increase of ~4.0 gC/kg in the proximal section (~42.5 gC/kg at P1 to ~46.5 gC/kg at P3) and a concave distal profile characterized by a decrease of ~0.1 gC/kg between P1 and P2 followed by an increase of gC/kg toward the top. In the 1.1% flow, IC decreases upward in the proximal siphons by ~2.1 gC/kg from P1 to P3 (~47.5 gC/kg to ~45.4 gC/kg), followed by an increase of ~0.5 gC/kg at the top; in the distal siphons, IC remains nearly uniform, increasing by ~1.6 gC/kg from P1 to P4 (~42.4 gC/kg to ~44.0 gC/kg). The 11% and 5.6% flows exhibit higher IC magnitudes and broader ranges in the proximal siphons compared to the distal ones. In comparison, the 3.6% and 1.1% flows exhibit smaller magnitudes and more uniform vertical distributions in both proximal and distal sections as described above. It is important to note that the distal siphon data from the 11% flow are partially compromised, as sediment blockage during the run likely restricted siphon sampling and reduced the collected volume at this position.
OC and IC exhibit concentration-dependent changes in their depositional and bypass behavior (Figure 4B, 4C). Bypass fractions for both components increase steadily from the 1.1% to the 3.6% flows, indicating that intermediate-concentration currents transport a larger proportion of their carbon load to distal positions. Beyond these two lower concentrations (1.1% and 3.6%), bypass fractions decrease with increasing concentration: at 5.6%, bypass declines to ~35% for IC and ~40% for OC, while the 11% flow shows predominantly depositional behavior, with only ~10–12% of OC and IC bypassed. Across all concentrations, OC bypasses slightly more than IC, suggesting a marginally greater mobility or reduced settling efficiency of organic material. The 11% flow deviates from this OC transport efficiency trend by showing high total deposition and comparatively low bypass, likely reflecting its lower sediment and carbon bypass efficiency.
Grain-size distributions from the siphon samples reveal complex vertical trends that vary with flow concentration and distance along the flume (Figure 5C). Rather than exhibiting consistent coarsening- or fining-upward trends, most flows show subtle and locally variable vertical changes, with clearer differences emerging between proximal and distal siphons. The highest-concentration flow (11%) shows greater vertical variability proximally than distally, whereas the 5.6% and 3.6% flows display modest but contrasting proximal–distal differences without a consistent vertical sorting direction. The most dilute flow (1.1%) exhibits weak fining-upward profiles at both siphon locations. Overall, these results indicate that concentration changes with respect to longitudinal positioning influence the grain-size distributions.
Distribution of OC, IC, and grain-size of the deposits
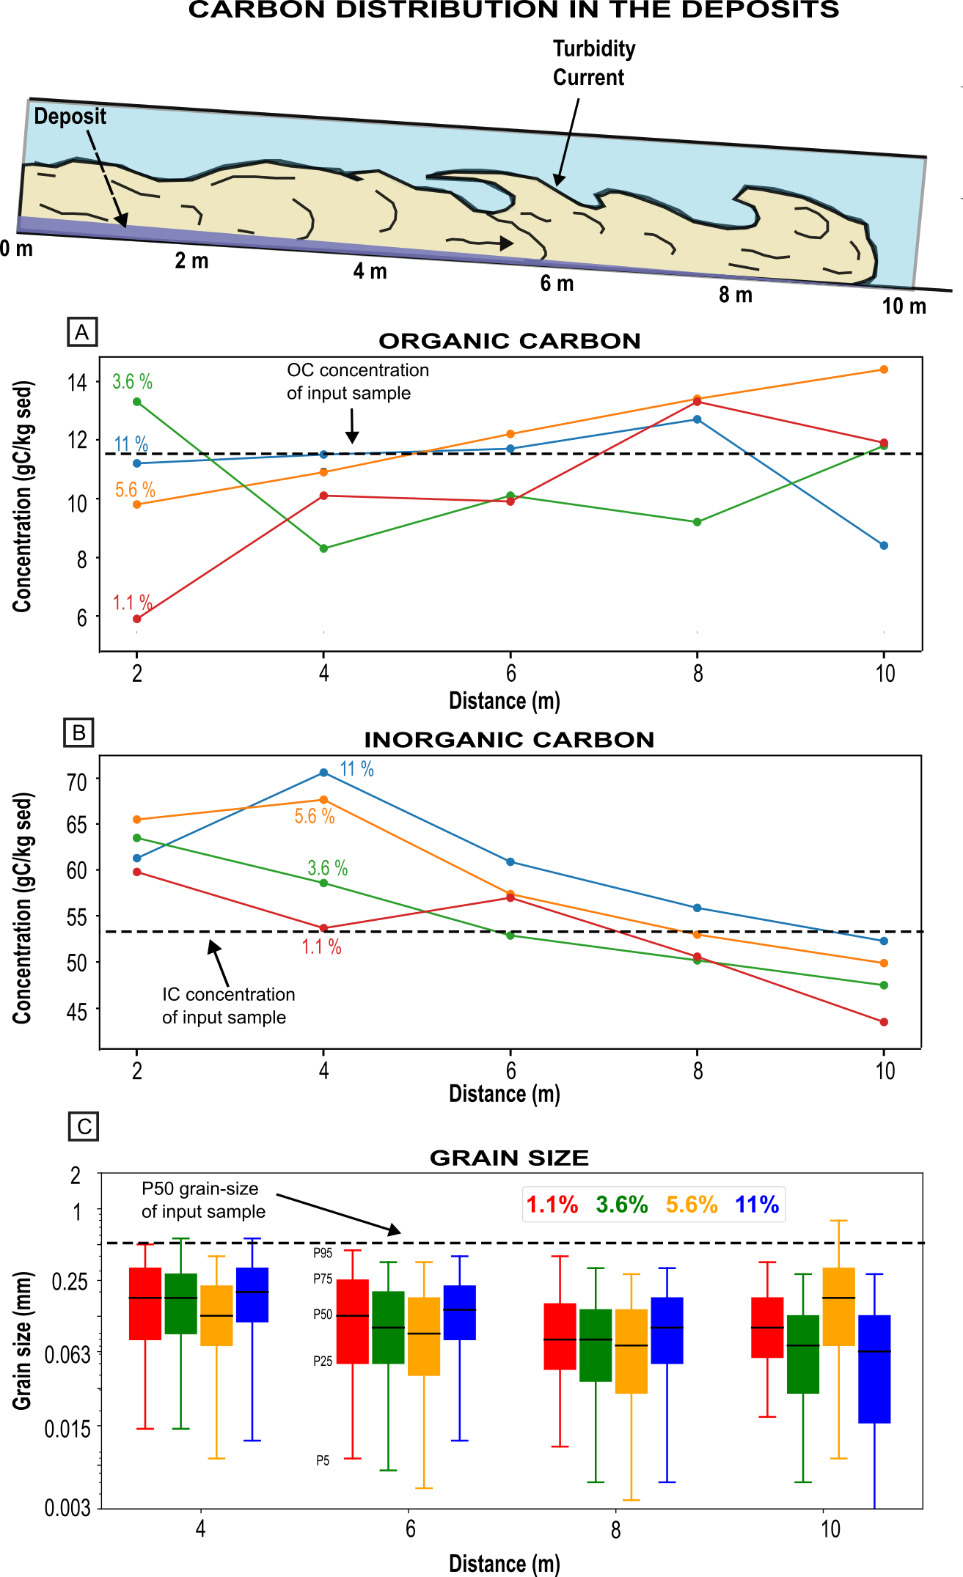
In all the experimental deposits, OC generally increases from proximal-to-distal, but trends vary with flow sediment concentration. The deposits of the 1.1% and 5.6% flows exhibit the clearest distal increase in OC, rising from ~5.9 to ~11.9 gC/kg (Δ ≈ +6.0 gC/kg; Here, Δ refers to distal concentration minus the proximal concentrations) in the 1.1% run and from ~9.8 to ~14.4 gC/kg (Δ ≈ +4.6 gC/kg) in the 5.6% run between 2 m and 10 m (Figure 6A). These runs show relatively consistent increases with distance compared to the deposits of the 3.6% flow, which displays greater variability, with OC values fluctuating between ~8.3 gC/kg and ~13.3 gC/kg. The deposit of the 11% concentration flow also follows an overall distal OC enrichment trend, with OC increasing from ~11.2 gC/kg at 2 m to ~12.7 gC/kg at 8 m, before decreasing to ~8.4 gC/kg at 10 m.
_organic_carbon_(oc)_and_(b)_inorganic_carbon_(ic)_concentrations_for_sediment_deposite.png)
In contrast, IC consistently decreases from proximal (2 m) to distal (10 m) for deposits from all four flow concentrations (Figure 6B). For the 11% flow, IC decreases from ~61.3 gC/kg to ~52.3 gC/kg (Δ ≈ −9.0 gC/kg), while the 5.6% flow shows a reduction from ~65.5 gC/kg to ~49.9 gC/kg (Δ ≈ −15.6 gC/kg). Similarly, the 3.6% flow exhibits a decrease from ~63.5 gC/kg to ~47.5 gC/kg (Δ ≈ −16.0 gC/kg), and the 1.1% flow shows the strongest decline, from ~59.8 gC/kg to ~43.5 gC/kg (Δ ≈ −16.3 gC/kg).
Bulk GSDs of all deposits show a consistent downslope fining trend, with coarse proximal deposits grading into finer, muddier sediments distally, except for the 5.6% run at the 10 m position (Figure 6C). In general, deposits display a distinct fining-upward succession, consisting of a coarse basal layer overlain by a 1–2 cm mud cap (Figure 3D). In higher-concentration runs, the mud caps occasionally contain coarse “floating grains” (Figure 3E).
Carbon burial trends in the modern Bahamian carbonate slope
The Great Bahama Bank (GBB) serves as a natural analog for our experimental results, providing a real-world example of how carbonate turbidity currents and other density currents transport and deposit sediment across slope settings. The data from the GBB slope, as documented in first five sequences of ODP Leg 166 (Eberli et al., 1997; Eberli & Betzler, 2019; Swart et al., 2000) (Figure 7), highlights the concentrations and spatial trends of OC and IC on a natural carbonate-reef-attached slope over a 5.4-million-year time period. The burial estimates assume that the OC and IC values sampled in the cores are representative across the entire western GBB slope and have not been subjected to significant diagenesis.
_regional_map_of_odp_leg_166_transect_along_the_great_bahama_bank._(b)_well_transect_il.png)
Across the western Bahamian transect, individual stratigraphic sequences (A–E) display variable longitudinal OC trends from proximal to distal wells (Figure 7C). Sequence A shows relatively uniform OC contents across the slope wells, with median OC values of ~4.4 gC/kg to 5.3 gC/kg. Sequence B exhibits consistently elevated OC across all wells, with median OC values ranging from ~16.1 gC/kg to 29.1 gC/kg and P95 values up to ~34.8 gC/kg, with no systematic proximal–distal trend. Sequence C displays low OC contents at proximal and mid-slope sites (~0.9–3.1 gC/kg), followed by a distal enrichment, increasing to ~5.0 gC/kg at Site 1006, corresponding to an approximately twofold increase relative to proximal locations, based on the median values. Sequence D shows uniformly low OC values across the transect, with median OC values of ~0.5–2.3 gC/kg, and no clear longitudinal trend. Sequence E exhibits a clear distal increase in OC, with median OC ranging from ~1.2 gC/kg to 3.0 gC/kg in proximal wells to ~2.3 gC/kg at Site 1006 and P95 values reaching ~9.3 gC/kg, representing up to a fourfold enrichment relative to proximal deposits based on the P95 values. In contrast, IC data from GBB shows a consistent proximal-to-distal decrease (Figure 7D). This trend is correlated to the slope break near Site 1007 (Figure 7B), and IC content decreases moving distally, away from the base of the slope (Figures 7B, 7D). Median IC values decline from ~113.5 gC/kg to 116.6 gC/kg in the proximal and mid-slope wells (Sites 1005–1003) to ~109 gC/kg to 112 gC/kg at Site 1007 and further to ~108.5 gC/kg at the most distal Site 1006. This pattern reflects a net downslope reduction of approximately 4 gC/kg to 8 gC/kg, equivalent to ~4% to 7% of the proximal IC content.
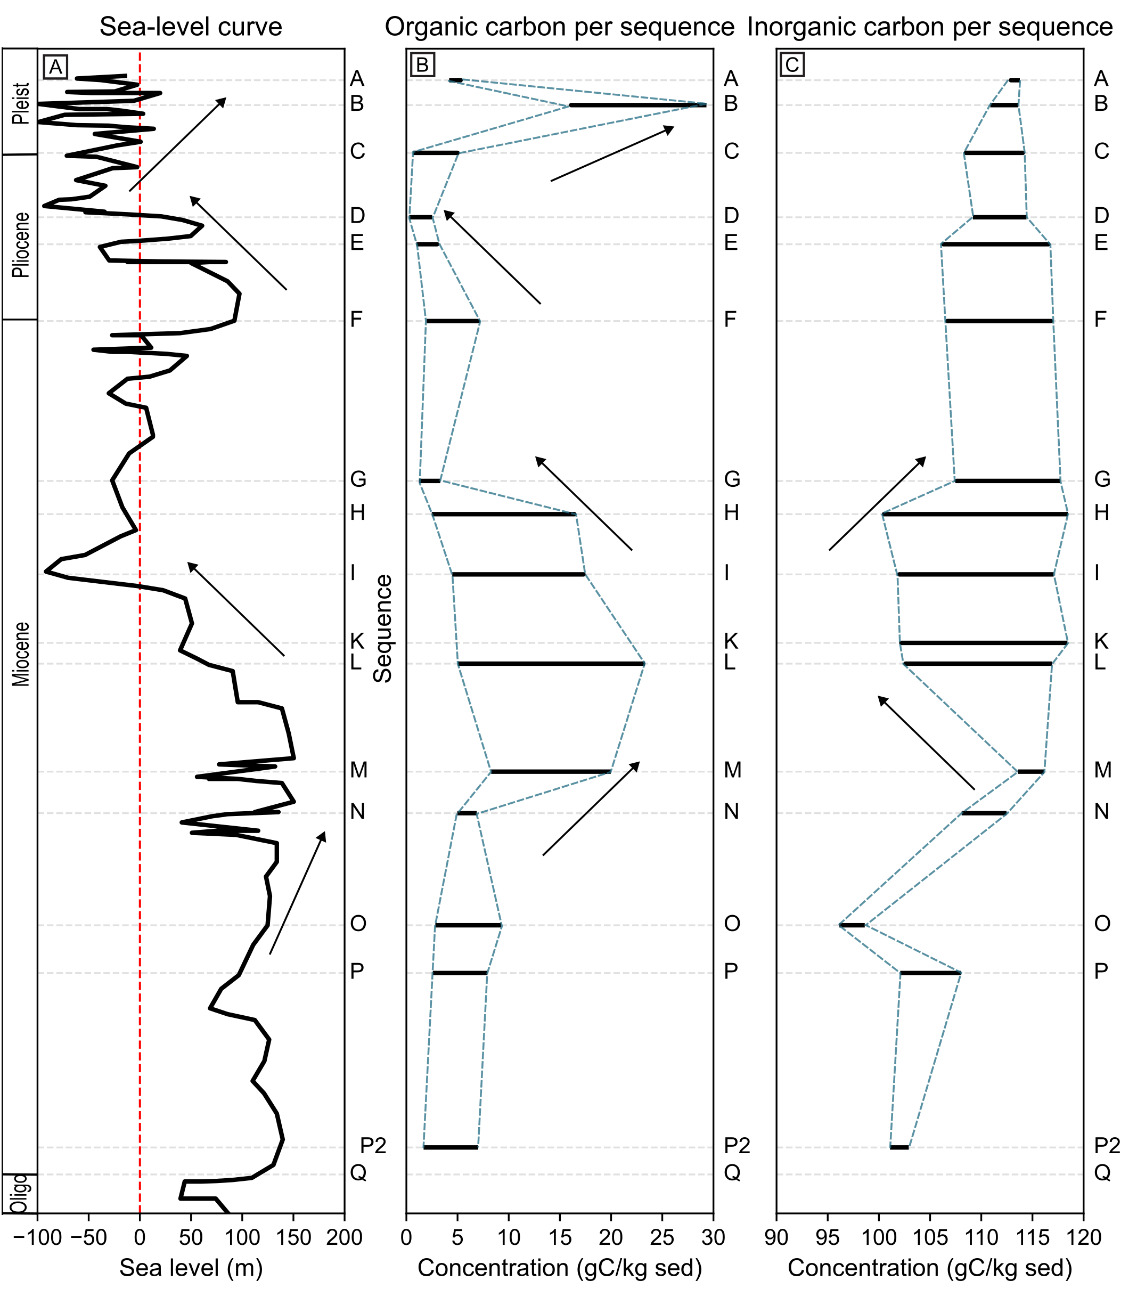
OC and IC content vary in a pattern that does not align directly with sea-level fluctuations but instead shows a delayed response, with organic carbon values generally increasing during sea-level highs, as observed from sequences N to L, and these elevated amounts persist even as sea level begins to fall (L to I) (Figure 8). A renewed increase in OC is also evident during subsequent sea-level rises from G to F and D to C. In contrast, IC content displays a narrower range but tends to increase following major sea-level highs (for example, from O to M), consistent with highstand shedding models (Schlager et al., 1994). Outside this interval, IC variations do not show a consistent relationship with sea-level position as seen in the OC distribution (Figure 8B). Together, these lag response patterns indicate a vertical offset between sea-level change and carbon burial, suggesting delayed feedback in carbonate slope carbon fluxes rather than an instantaneous sedimentary response.
_sea-level_cycles_(adapted_from__b_563649___original_global_cycle_chart_from_haq_et_al.png)
Carbon burial volume and flux budget in the modern Bahamian carbonate slope
Deposit thicknesses and time intervals from ODP Leg 166 wells, spanning 5 to 25×10⁶ years, were used to estimate sediment mass and burial flux along the western GBB slope (Table 2). Estimated carbon inventories show that IC constitutes most of the total carbon on the GBB slope, whereas OC represents a smaller fraction (Table 3). In all cases, IC volumes are more than an order of magnitude higher than OC volumes. Also, IC fluxes are consistently greater than OC fluxes by roughly one to two orders of magnitude across all estimated scenarios. The calculated carbon burial fluxes (Table 4) are time-averaged estimates based on calculated sediment masses and accumulation durations across intervals that span both sea-level high stands and low stands. As a result, the calculated fluxes do not resolve short-term variability associated with individual sea-level episodes.
DISCUSSION
Hydrodynamic controls on OC and IC transport and burial
The experimental results show that the transport and burial of OC and IC in carbonate turbidity currents are primarily governed by hydrodynamic sorting and flow concentration (Figures 5 and 6). Because the particle density of organic matter (OM) is significantly lower than that of mineral grains (Deng et al., 2022), hydrodynamic sorting, driven by differential settling velocity (e.g., De Kruijf et al., 2021; Slootman et al., 2023), preferentially retains OM within finer sediment fractions (e.g., clays) that have lower settling velocities and remain in suspension longer within the flow, while coarser carbonate minerals with higher settling velocities are transported and deposited earlier along the flow path (Bornhold & Pilkey, 1971; Komar, 1985; Sadler, 1982; Van Tassell, 1981).
The IC concentration in the suspended flow samples suggests that they are preferentially transported and deposited near the bed, and deposited earlier relative to OC. This effect is particularly pronounced in the lower concentration flows (3.6% and 1.1%), where IC values in the proximal siphons are consistently higher than those in their distal counterparts. The trend is vertically more uniform in the lower concentration flows (1.1% and 3.6%), which shows reduced vertical stratification of IC within the flow. In contrast, the higher-concentration flows (5.6% and 11%) exhibit stronger vertical IC gradients, with elevated near-bed concentrations and greater vertical variability, consistent with enhanced flow stratification and increased proportion of IC within dense basal layers. These patterns indicate that IC transport in our experiment is dynamically coupled with high settling velocity carbonate grains, as reflected by grain-size distributions showing stronger longitudinal (proximal-to-distal) variability than systematic vertical segregation within the sampled flow (Figure 5B-C).
On the other hand, because OM (and therefore OC) tends to remain suspended for longer durations and is transported farther downstream. This effect is particularly pronounced in lower concentration flows (3.6% and 1.1%), where OC values in the distal siphons are consistently higher than those in their proximal counterparts (Figure 5A). The trend is vertically more complex for the higher concentration flows (5.6% and 11%), which maintain elevated OC concentration in the upper part of their flows at both the proximal and distal locations. Together, these observations indicate that OC transport in the experiments is dynamically coupled with lower settling velocity, fine-grained sediment that is preferentially retained in suspension, and advected downstream (Nworie, Jobe, Slootman, Venturelli, et al., 2025). The similar hydrodynamic behavior and bonding tendency between clays and OM suggest that extensive research on clay transport and deposition can also be applied to understanding OC transport and burial (also noted by Talling et al., 2024).
Although OC enrichment is generally expected to occur in the upper portion of the flow, due to the lower bulk density and lower settling velocity of OC relative to carbonate mineral grains, our results show that this behavior tends to vary systematically with flow concentration (Figures 5A and 5B). In the higher-concentration flows (11% and 5.6%), strong vertical stratification promotes the development of a dilute upper layer in which OC concentrations peak in the upper siphons. In contrast, the lower-concentration flows (3.6% and 1.1%) are more weakly stratified, resulting in a more vertically mixed flow where OC concentrations are distributed more evenly and may peak at mid-depth or lower siphon levels. These differences indicate that OC transport is dominantly suspended but that its vertical distribution is controlled by concentration-dependent flow structure and stratification, rather than by particle density alone. As a result, OC enrichment within the flow is dynamic and sensitive to sediment concentration, flow organization, and downstream evolution along the flume.
The experimental deposits reinforce the contrasting transport behavior of OC and IC observed within the flows (Figure 9). OC concentrations in the deposits generally increase downstream, but this enrichment is variable and strongly dependent on flow concentration, reflecting intermittent partitioning between suspension and near-bed transport controlled by flow structure and stratification. IC concentrations in the deposits decrease systematically downstream, regardless of the initial sediment concentration of the flow (Figure 6). However, IC concentrations in the deposits are higher than those measured in the flows sampled via siphons, indicating that IC-bearing particles are preferentially transported near the bed and deposited earlier than OC (Figure 5).
Grain-size distributions from siphon samples show weak and locally variable vertical sorting, with clearer differences between proximal and distal positions rather than consistent coarsening- or fining-upward trends (Figure 5C). Because the siphons at 4 m and 7 m sampled preferentially the near-bed, high-density portion of the flow, the observed grain-size signal is biased towards the basal-layer transport and therefore better reflects longitudinal variability than vertical segregation. The absence of strong, systematic grain-size segregation indicates that classical size sorting was modified by concentration-dependent flow structure and the presence of carbonate mud, which lowers the threshold for segregation suppression relative to siliciclastic systems (Amy et al., 2006; Reijmer et al., 2025). As a result, downslope fining in the deposits supports preferential but variable distal transport of fine, OC-rich material and proximal enrichment of coarse, IC-rich grains, influenced by concentration-dependent flow structure rather than simple grain-size sorting alone (Figures 5A-C).
Measurement uncertainty also contributes to the observed grain-size variability in the siphon samples. Laser-diffraction methods estimate an equivalent spherical diameter, which can introduce systematic bias when applied to irregular, platy, or skeletal carbonate grains (Braithwaite, 1973; Maiklem, 1968; Slootman et al., 2025), commonly resulting in uncertainties on the order of a few tens of percent for individual grain-size classes (Counts et al., 2021; De Kruijf et al., 2021; Nworie & Jobe, 2025). Such uncertainty is sufficient to obscure subtle vertical sorting signals but does not affect the first-order proximal–distal trends observed. The wide range of grain morphologies, therefore, produces overlapping settling velocities that could also contribute to the heterogeneous grain-size distributions measured in the siphon samples.
An additional factor that may explain the slight deviations from the complete idealized hydrodynamic partitioning observed in our experiments is the possible presence of a very small amount of coarse organic debris in the input sediment. Natural turbidity currents often transport a mixed assemblage of carbon-bearing materials, including fine-grained organic matter bound to clays (Blair & Aller, 2012) as well as coarser terrestrial vegetation fragments (Saller et al., 2006). Recent studies have shown that sandy turbidites can contain substantial amounts of plant-derived organic material, with woody debris and leaf fragments (Saller et al., 2006; Spychala et al., 2025). Such material, due to its larger size and variable density, settles rapidly and is likely to accumulate in proximal sandy facies together with carbonate grains and other dense particles. The lack of significant coarse organic components in our experimental mixtures likely simplified the observed OC vs. IC behavior, producing more uniform distal enrichment patterns than might occur in natural systems where both fine and coarse organic fractions coexist (McArthur et al., 2016).
OC and IC burial on the modern Bahamian carbonate slope
The OC distribution along the western Bahamian transect indicates a tendency toward distal enrichment, but this pattern is neither uniform nor monotonic across stratigraphic sequences. (Figure 7C). Sequences A, C, D, and E show broadly similar OC contents, with enrichment present in Sequences C and E, where OC increases by approximately twofold based on median values (Sequence C) and up to fourfold based on upper-bound (P95) values (Sequence E) at the most distal site. Sequence B exhibits anomalously high OC values at all sites and lacks a systematic proximal–distal trend, suggesting that OC burial during this interval was dominated by sequence-specific controls, such as changes in sediment supply, preservation efficiency, or organic-matter input. These variabilities in OC concentration pattern indicate variable down-slope transport of organic matter (Figures 8, 9).
_and_inorganic_carbon_(ic)_transfer_by_carbonate_turbidity.png)
In contrast, IC concentrations display a clear proximal-to-distal decrease (Figure 9), although with a higher range than the OC (Figure 7D). This pattern mirrors the experimental results, where IC-bearing carbonate grains were preferentially transported near the bed and deposited proximally, leading to systematic downstream depletion. The higher variability in IC concentrations along the transect likely reflects the superposition of this hydrodynamic sorting signal with spatial and temporal differences in sediment supply and post-depositional modification such as winnowing, reworking, or partial dissolution or removal of carbonate material (Eberli & Betzler, 2019; Mulder et al., 2019; Swart & Eberli, 2005; Wunsch et al., 2018). In addition, variations in the relative contributions of lagoon-derived aragonite mud versus platform-margin–derived silt- to sand-sized carbonate grains can shift bulk IC content along the slope in platform margin and reef environments (Andresen et al., 2003; Droxler & Schlager, 1985; Lopez-Gamundi et al., 2024, 2025; Purkis et al., 2023; Schlager et al., 1994). Together, these processes explain why IC shows a more consistent downslope decrease while still exhibiting greater variability than OC across individual sequences.
Unlike our experimental results, the Bahamian slope represents a mix of periplatform ooze, a mix of platform-derived aragonite mud and pelagic input, and sediment deposited by turbidity currents (Bernet et al., 2000; Eberli et al., 1997), which responded to sea-level changes and other boundary conditions (Reijmer et al., 2002). Furthermore, bottom currents and cascading density currents were active during the Pliocene (Eberli & Betzler, 2019; Mulder et al., 2019; Wunsch et al., 2018), likely reworking sediments previously deposited by turbidity and density flows. These processes may have winnowed or eroded organic-rich layers, thereby altering the original proximal-to-distal OC signal by redistributing to secondary locations and/or exposing OC to oxygenated bottom water, enhancing OC remineralization. However, this is still the most complete dataset to study proximal-to-distal changes in IC and OC and serves as a call for more datasets to be collected.
Sea-level variations and associated ocean chemistry changes exert an additional control on OC and IC accumulation (Figure 8) (Swart & Eberli, 2005). During highstands, tropical carbonate platforms shed more sediment onto the slope (Reijmer et al., 2002; Schlager et al., 1994). This enhanced sediment export increases the delivery of OC by transporting organic matter associated with carbonate mud, planktonic biomass, and microbially produced organic material from the platform and upper slope. At the same time, higher sedimentation rates promote OC preservation by reducing oxygen exposure time and limiting remineralization. In addition, because IC is directly sourced from carbonate grains, increased carbonate export also promotes IC delivery to the basin.
However, from the GBB dataset, this relationship is not expressed as an immediate increase in OC and IC in the rock record during highstands. Instead, sea level directly controls sediment production and export from the platform (Schlager et al., 1994), while carbon accumulation on the slope responds indirectly and with a temporal delay. As a result, changes in OC and IC are recorded as lagged rather than synchronous responses to sea-level fluctuations (Figure 8). This delay is not consistent across all sequences and likely reflects variability in sediment routing efficiency, temporary sediment storage on the slope, and post-depositional stabilization processes. As a result, changes in OC and IC are recorded as lagged rather than synchronous responses to sea-level fluctuations. Carbon burial therefore reflects an integrated response to sea-level forcing rather than an instantaneous signal.
Conversely, during sea-level lowstands, reduced sediment export from carbonate platforms (Reijmer et al., 2002; Schlager et al., 1994) does not necessarily imply reduced OC supply but can lead to lower OC preservation efficiency due to reduced sedimentation rates and increased oxygen exposure time. Periods of enhanced bottom-water ventilation and reworking during lowstands may further promote OM degradation and selective OC loss after deposition, rather than uniformly oxygen-rich conditions (Kramer et al., 2000; Swart & Eberli, 2005). Burial diagenesis may therefore overprint original depositional OC signals, contributing to muted or reduced OC proportions in some lowstand intervals.
Mass-balance and burial-flux estimates based on stratigraphic data from ODP Leg 166 (Tables 2-4) suggest that IC constitutes most of the total buried carbon along the slope, exceeding OC by one to two orders of magnitude. The estimated total carbon burial on the western GBB (0.01 to 0.25 MtC/year; 0.1 × 10⁻⁴ to 2.5 × 10⁻⁴ PgC/year) represents a measurable contribution (0.005–0.13%) of the current estimated global annual oceanic carbon export flux of 0.2 PgC/year (200 MtC/year) (Regnier et al., 2013; Middelburg, 2019; Friedlingstein et al., 2022). The dominance of IC underscores the important role of turbidity currents in redistributing and burying carbon in deep-marine carbonate environments.
Applicability of experimental results to natural systems
Our laboratory experiments provide process-based insights into the hydrodynamic sorting of OC and IC during turbidity-current transport, but they do not attempt to directly reproduce the full complexity of open-ocean systems. Processes such as sea-level change, contour currents, and diagenesis act over longer timescales and are beyond the scope of flume experiments (Roth & Reijmer, 2004, 2005; Schlager et al., 1994; Swart, 2008, 2015; Swart & Eberli, 2005). Instead, the experiments highlight first-order depositional controls, specifically particle properties (size, shape, and density), settling velocity, and sediment concentration, that govern how sediment and carbon-bearing particles are partitioned between the proximal and distal parts of turbidity-current depositional systems (De Kruijf et al., 2021; Slootman et al., 2023).
The experimental results demonstrate that denser, carbonate-rich particles (IC-bearing) are deposited preferentially in proximal settings, whereas lighter, fine-grained, OM-bearing particles (OC-bearing) are tend to be transported farther and deposited under lower-energy conditions; however, OC transport and deposition are more complex and not strictly monotonic, as OC may be redistributed and sensitive to additional processes such as flow structure, sediment concentration and OC type. In the Great Bahama Bank (GBB) dataset, the IC trend, decreasing concentrations with distance from the slope base, closely matches this experimental pattern, confirming that IC transport and deposition are primarily controlled by hydrodynamic sorting and settling efficiency. However, the OC trend in the natural record does not show a similar strong relationship with distance downslope, suggesting that OC transport is more variable and sensitive to additional processes, such as transport mode, bottom-current reworking, variable sediment supply, and post-depositional degradation, which may have modified the hydrodynamic signal. Accordingly, the burial-flux estimates presented here are intended as first-order, time-averaged approximations rather than precise global flux values, as they integrate over multiple depositional environments, sea-level states, and post-depositional processes. These results therefore provide essential process-based insights that complement long-term natural records and highlight sediment-routing pathways that are underrepresented in current carbon-cycle models and budgets.
Role of turbidity currents in the global carbon cycle
Results from this study demonstrate that carbonate turbidity currents exert a strong control on both OC and IC partitioning, as shown by concentration-dependent transport and deposition in the flume experiments (Figures 5–6) and by consistent proximal-to-distal IC depletion on the Great Bahama Bank (GBB) slope (Figure 7D). For decades, siliciclastic turbidity currents were considered largely inactive in the present-day global carbon cycle because high sea levels were thought to disconnect terrestrial sediment supply from the deep ocean (Khripounoff et al., 2012; Posamentier & Kolla, 2003). Recent direct seafloor monitoring, however, has shown that these flows remain active (Azpiroz-Zabala et al., 2017) and capable of transporting substantial volumes of OC to deep-sea environments (Baker et al., 2024; Talling et al., 2024). Earlier carbon cycle models often assumed that river-derived OC was buried mainly in deltas or on continental shelves, where most of the carbon is remineralized (Berner, 1980, 1982, 1989; Blair & Aller, 2012; Burdige, 2007; Hedges et al., 1997). This assumption likely underestimated the contribution of turbidity currents to global carbon burial. Past studies propose that carbon flux attenuates with depth, with only ~0.2 PgC/yr preserved in sediments from an initial 50 PgC/yr fixed in surface waters (Middelburg, 2019). Yet, turbidity-current deposits may contain high OC contents (0.4 to 10%) (Baker et al., 2024; Kramer et al., 2000; Rabouille et al., 2017, 2019; Talling et al., 2024), exceeding global average values commonly assigned to deltaic deposits (0.75% OC), continental shelf deposits (1.5%) (Berner, 1982, 1989), and rivers (1.1 to 1.6% OC) (Blair & Aller, 2012; Talling et al., 2024). Turbidity currents bypass the remineralization bottleneck on shorelines, deltas, and carbonate platforms, efficiently delivering OC (and IC in carbonate settings) to the deep sea (Baker et al., 2024; Galy et al., 2007; Hage et al., 2020, 2022, 2024), providing a globally significant pathway for preservation that challenges the long-held view of the limited role of deeper marine processes in carbon burial and preservation (Cai & Reimers, 1995; Glud, 2008; Jørgensen, 1982; Middelburg, 2018).
In carbonate settings, however, there is even less data constraining carbon burial. In addition to IC, carbonate systems also supply OC, though at rates that remain poorly constrained (Zeller et al., 2024). OC sources include coastal vegetation, phytoplankton, bacterially-derived extracellular polymeric substances (EPS), and benthic algae (e.g., Briggs et al., 2013; Donato et al., 2011; Li et al., 2022). Our experimental results show that carbonate turbidity currents can sort and redistribute these carbon pools differentially, producing variable OC enrichment and IC retention patterns that depend on flow concentration and transport efficiency. The combined burial flux of IC and OC in carbonate provinces is also considerable and important for understanding and improving global carbon budgets (Middelburg, 2019; Millero, 2006, 2007).
IC burial and storage
The long-term climatic importance of carbon burial by turbidity currents arises from long-term preservation over geologic timescales (Galy et al., 2007; Hage et al., 2024; Middelburg, 2019; Talling et al., 2024). Estimates suggest that only about 20–60% of CaCO₃ produced in the ocean surface escapes dissolution to be buried in marine sediments (Feely et al., 2004; Millero, 2006, 2007; Orr et al., 2005). Turbidity currents and sediment density flows enhance this burial efficiency by transporting carbonate-rich sediments downslope into deep-sea basins, where subsequent burial reduces contact with undersaturated waters (e.g. Le Goff et al., 2021). In doing so, sediment density flows and turbidity currents stabilize redistributed IC and prevent its rapid re-entry into the ocean–atmosphere system. While this mechanism does not constitute new atmospheric CO₂ sequestration, it effectively locks IC into long-term geologic reservoirs, lowering the risk of dissolution-driven CO₂ release (Galvez & Gaillardet, 2012; Galy et al., 2015; Hilton, 2017; Sundquist, 1993). Thus, carbonate burial should be framed as a preservation pathway that complements OC burial in shaping long-term carbon storage in the oceans.
The efficiency of IC burial is primarily influenced by the carbonate compensation depth (CCD), i.e., the depth in the ocean at which CaCO3 starts to dissolve significantly (Keil, 2017). The modeled CCD in the Bahamas and Northwest Atlantic is 5,402 ± 346 m for pre-industrial times, and 5,086 ± 185 currently (Sulpis et al., 2018), well below the Great Bahama Bank (GBB) slope transect of interest (Figure 7B). The proximal enrichment in IC seen in both our flume experiments and the GBB implies that a significant amount of IC will be preserved well above the CCD. Although shallow burial may still be affected by microbial degradation and localized dissolution (particularly if OC and IC co-occur) (Schwarz & Rendle-Bühring, 2005), this effect is likely to be minimal. Importantly, about half of all marine carbonate burial occurs on continental margins and slopes (Keil, 2017), highlighting the significant role of margin processes in transferring IC from dynamic platform tops into long-term sedimentary sinks.
In shallow-water settings, the burial and stabilization of inorganic carbon (IC) are enhanced by early diagenetic processes that favor long-term preservation of carbonate sediments (e.g., freshwater cementation processes, syndepositional marine cementation, and microbial-induced stabilization; Dravis, 1996; Grammer et al., 1999; Reolid et al., 2017). However, when these shallow-water deposits are exposed during sea-level lowstands, they can undergo karstification and dissolution, leading to the loss of previously stored carbon. Ultimately, the efficiency of the carbonate sedimentary sink for both IC and OC depends on the dynamic balance between early diagenetic stabilization and subsequent subaerial erosion.
Finally, carbonate burial can be viewed within the broader geochemical carbon cycle, where carbon partitions between short-lived “surficial” sinks (atmosphere, oceans, biosphere, soils, and carbonate edifices) and long-term “geologic” sinks (crustal rocks and buried sediments) (Berner & Caldeira, 1997; Ridgwell & Zeebe, 2005). Once carbonate is buried or stored in the carbonate platform itself, it is effectively locked out of the short-term cycle, preventing its dissolution and re-release of CO₂ (Derry, 2024; Keil, 2017).
OC burial efficiency
OC burial efficiency, i.e. the fraction of delivered OC that is preserved in sediments, is strongly influenced by sedimentation rate, oxygen exposure, and OC source (Galy et al., 2007). Marine OC is typically more labile and remineralized rapidly than terrestrial OC, which tends to be more refractory and resistant to degradation (Blair & Aller, 2012; Regnier et al., 2022). Turbidity currents enhance burial efficiency because they deliver exceptionally high sediment accumulation rates that reduce oxygen exposure and promote preservation (Bernet et al., 2000; Galy et al., 2007; Lopez-Gamundi et al., 2024, p. 2005; Rendle-Bühring & Reijmer, 2005; Talling et al., 2024). For example, the 11% experimental flow produced thick deposits enriched in OC. Such deposits could reflect periods of rapid sedimentation. Previous findings suggest that rapid sedimentation creates conditions favorable for long-term OC sequestration (Galy et al., 2007; Hage et al., 2020, 2024; Talling et al., 2024).
Together, these findings from previous studies indicate that canyon-linked turbidity systems can achieve burial efficiencies well above the 10–44% range, and in some reported instances approaching complete transfer of riverine OC to the deep ocean from siliciclastic systems (Baker et al., 2024; Hage et al., 2024; Talling et al., 2024). Comparable observations have been made in carbonate-dominated systems, where the transfer of shallow-marine–derived OC and inorganic carbon (IC) toward the deep ocean has been documented for the northern Little Bahama Bank (Mulder et al., 2018; Recouvreur et al., 2021) and within Exuma Sound, the semi-enclosed deep-water basin of the Great Bahama Bank (Le Goff et al., 2021; Mulder et al., 2019). In these settings, not only carbonate turbidity currents but also seasonal and climate-driven carbonate suspension flows contribute significantly to deep-ocean carbon burial (Lopez-Gamundi et al., 2024, p. 2005; Roth & Reijmer, 2004, 2005). This transfer challenges long-standing assumptions that most terrestrial OC is remineralized on continental shelves (Aller, 2013; Berner, 1980, 1982; Boudreau, 1997; Middelburg, 2018) and highlights the globally significant role of turbidity currents in carbon burial.
CONCLUSIONS
We demonstrate that the transport of organic carbon (OC) from organic matter and inorganic carbon (IC) fixed in CaCO₃ in carbonate turbidity currents is strongly influenced by sediment concentration and hydrodynamic sorting. Our experiments show that OC transport is more variable, though it tends to be enriched in distal deposits, whereas IC is deposited preferentially in proximal settings due to its higher settling velocities.
These experimental results align with OC and IC distribution patterns from the western slope of the Great Bahama Bank, indicating that the observed experimental processes are consistent with natural carbonate-slope systems. Although our experiments and the Great Bahama Bank analog demonstrate the efficiency of carbonate turbidity currents in transporting and preserving OC and IC, it is important to recognize that other processes, such as contour currents, winnowing, and diagenesis, also influence the redistribution and long-term fate of carbon in the deep sea.
A key distinction between carbonate and siliciclastic systems is the dual transport of both OC and IC, with the latter largely absent in siliciclastic-dominated settings. In carbonate environments, turbidity currents as well as carbonate sediment density flows enhance the preservation of redistributed IC by delivering it to deeper basins, where burial reduces the exposure of IC to corrosive waters and limits the likelihood of dissolution-driven CO₂ release, thereby contributing to long-term carbon preservation by stabilizing carbon in geologic sinks.
These findings emphasize the importance of including carbonate turbidity currents and carbonate sediment density flows in discussions of global carbon cycling, which is not the case currently. While the precise global magnitude of the contribution of carbonate turbidity currents and carbonate sediment density flows to the burial of carbon remains uncertain, our results highlight that they provide an underappreciated mechanism of OC and IC transfer and burial. The modelled Great Bahama Bank slope alone contributes approximately 0.01 to 0.25 MtC/year (0.1 × 10⁻4 to 2.5 × 10⁻⁴ PgC/year), representing 0.005–0.13% of the present-day global oceanic carbon export flux of ~0.2 PgC/year. Incorporating carbonate turbidity currents as important pathways for OC and IC transport, redistribution, and long-term burial in deep-marine settings into global carbon-cycle models and budgets will improve assessments of how sediment sinks regulate carbon storage and Earth’s climate over geologic timescales.
ACKNOWLEDGMENTS
We thank the staff of the Geolab and Earth Simulation Laboratory at Utrecht University for assistance with the analysis of this work, and specifically Pelle Adema, Mateus Kroth, and Pinheiro Pimenta, for their help during the flume experiments. This work was supported in part by the American Chemical Society Petroleum Research Fund (ACS-PRF), the Rocky Mountain Association of Geologists Foundation, and the Department of Geology and Geological Engineering at the Colorado School of Mines. Input sediment collection in Saudi Arabia and transport to Utrecht University (The Netherlands) was generously supported by King Fahd University of Petroleum and Minerals (Dhahran, Saudi Arabia). Former Dean Al-Kaabi is thanked for his support. We are grateful to the anonymous reviewers whose thoughtful feedback and detailed suggestions greatly enhanced the rigor and clarity of an earlier version of this work.
Ethics declarations
The authors declare that they have no known competing personal relationships or financial interests that could have appeared to influence the work reported in this paper.
Data availability statement
All data generated or analyzed during this study are included in this published article.
Authors contribution statement
Nworie, C. D.: Conceptualization, Data curation, Formal Analysis, Investigation, Methodology, Software, Validation, Visualization, Writing – original draft, Writing – review & editing. Jobe, Z. R.: Conceptualization, Funding acquisition, Project administration, Supervision, Validation, Writing – review & editing. Slootman, A.: Samples, Conceptualization, Data curation, Methodology, Validation, Visualization, Writing – review & editing. Venturelli, R.: Methodology, Validation, Writing – review & editing. Eggenhuisen, J.: Methodology, Validation, Writing – review & editing. Reijmer, J. J. G.: Samples, Funding acquisition, Methodology, Validation, Writing – review & editing.
