Introduction
Ooids are concentrically coated calcium carbonate grains that typically form in alkaline lake and shallow marine environments. Understanding the environmental parameters (chemical, physical, and biological) that control the characteristics of modern ooids—e.g., composition, cortical fabric, size, and shape—enables us to better leverage the potential of ooids as paleoenvironmental proxies. For example, the mineralogy of Phanerozoic marine ooids (i.e., calcite vs. aragonite) reflects the seawater chemistry in which they formed (calcite vs. aragonite seas) (Sandberg, 1975). Ooid size and shape can also serve as indicators of the hydrodynamics and aqueous carbonate chemistry of their depositional environments (Li et al., 2021; Sipos et al., 2018; Sumner & Grotzinger, 1993; Trower et al., 2020).
Despite decades of study, the mechanisms that govern ooid genesis and growth remain a contentious topic. Recent work has focused on determining whether ooid growth is primarily driven by physiochemical factors or is mediated by microbial activity. For example, in the Bahamas (marine) and Lake Geneva (lacustrine), the microbial communities that mediate carbonate precipitation in microbial mats are similar to those found within the cortices of adjacent ooid sand, which has been interpreted to imply that microbial activity drives ooid growth in these locations (Diaz et al., 2014, 2017; Edgcomb et al., 2013; Pacton et al., 2012; Plee et al., 2008). In contrast, studies of other ooids in the Bahamas and the Turks and Caicos Islands have demonstrated that ooid growth in these locations is primarily physicochemical (Duguid et al., 2010; Trower et al., 2018). In all these cases, isolating the impact of microbial activity on mineral precipitation has proven challenging given the ubiquity of microbial biofilms and carbonate-supersaturated waters in the environments in which ooids form.
The shallow saline waters of the Great Salt Lake (GSL), Utah (USA) are host to abundant ooid sand (Eardley, 1938; McGuire, 2014). Beginning with work by Eardley (1938), GSL ooids have received significant attention as useful analogues for ooid formation processes based on the diversity of cortical fabrics observed, including relatively large radially oriented needles, finely laminated concentric layers, and a hybrid radial-concentric fabric (Sandberg, 1975). GSL ooids typically nucleate on brine shrimp fecal pellets but also commonly contain nuclei composed of quartz and other terrigenous material. With few exceptions, modern marine ooids, such as those occurring on Caribbean carbonate platforms, lack the radial microfabric observed in GSL ooids (Kahle, 1974). Dissimilarity in cortical textures between lacustrine and marine ooids has been posited to reflect the energy of the depositional environment, with environments with less frequent sediment transport thought to allow more time for development of large, radially-oriented crystals (Heller et al., 1980).
Based on crystal morphology, Eardley (1938) concluded that >90% of the radial grain structure in GSL ooids was composed of calcite, but later investigators recognized that GSL ooids are primarily aragonite (Kahle, 1974; Sandberg, 1975). Eardley (1938) also observed that the remaining 10% of the grain composition consisted of darker material interspersed throughout ooid cortices. This dark non-aragonitic material has been previously interpreted as dolomite (Eardley, 1938), intermeshed micrite (Sandberg, 1975), and/or hydrated sepiolite clays (McGuire, 2014). A recent study documented the occurrence of amorphous Mg-silicates found in GSL microbialites and suggested that the precipitation of these minerals was mediated by microbial activity via local increases in pH (Pace et al., 2016).
There are three major controls on Mg-silicate nucleation: pH, [Mg2+], and [SiO2] (Tosca & Wright, 2018). Experiments have demonstrated that the poorly crystalline precursors to Mg-silicate clay minerals cannot form below pH ~8.7 (Tosca et al., 2011), including under conditions with [Mg2+] three times higher than in GSL lake water (Ingalls et al., 2020). Characteristic pH values of lake water and pore waters in GSL shorelines dominated by ooid sand are below this threshold (pH < 8.3) (Ingalls et al., 2020), even though [Mg2+] and [SiO2] are sufficient for Mg-silicate formation (Ingalls et al., 2020; Stephens & Gillespie, 1976). Several types of microbial metabolisms (including, notably, photosynthesis) can create local microenvironments with higher pH than ambient pore waters. Other types of microbial metabolisms can increase pH by increasing alkalinity under anoxic and/or microaerophilic conditions, as illustrated in the following simplified metabolism:
Sulfate reduction: 2CH2O + SO42- ⇒ 2HCO3- + HS- + H+
Sulfide oxidation to S0: 2HS- + CO2 + 2H+ ⇒ CH2O + 2S0 + H2O
We hypothesize that microbial sulfur cycling (sulfate reduction alone coupled with partial sulfide oxidation to S0) could provide a local pH boost that enabled Mg-silicate precipitation to proceed on ooid surfaces.
Both sulfate-reducing and sulfide-oxidizing bacteria have been identified on the surfaces of GSL ooids via 16S rRNA gene sequencing (Ingalls et al., 2020). In particular, the sulfide oxidizers Chromatiaceae, including Thiohalocapsa reported from GSL ooids and microbialites, are known to store partially oxidized sulfur in intracellular globules (Diaz et al., 2017; Steudel, 1989). If these microbial metabolic processes contribute to Mg-silicate formation, we expect to find reduced sulfur phases (sulfides or S0) spatially associated with Mg-silicates within ooid cortices, which would differentiate this from photosynthesis as the primary driver of Mg-silicate formation. We examine the spatial relationships of Mg-silicates and aragonite within ooid cortices to determine their paragenetic history.
Materials & Methods
Light And Electron Microscopy
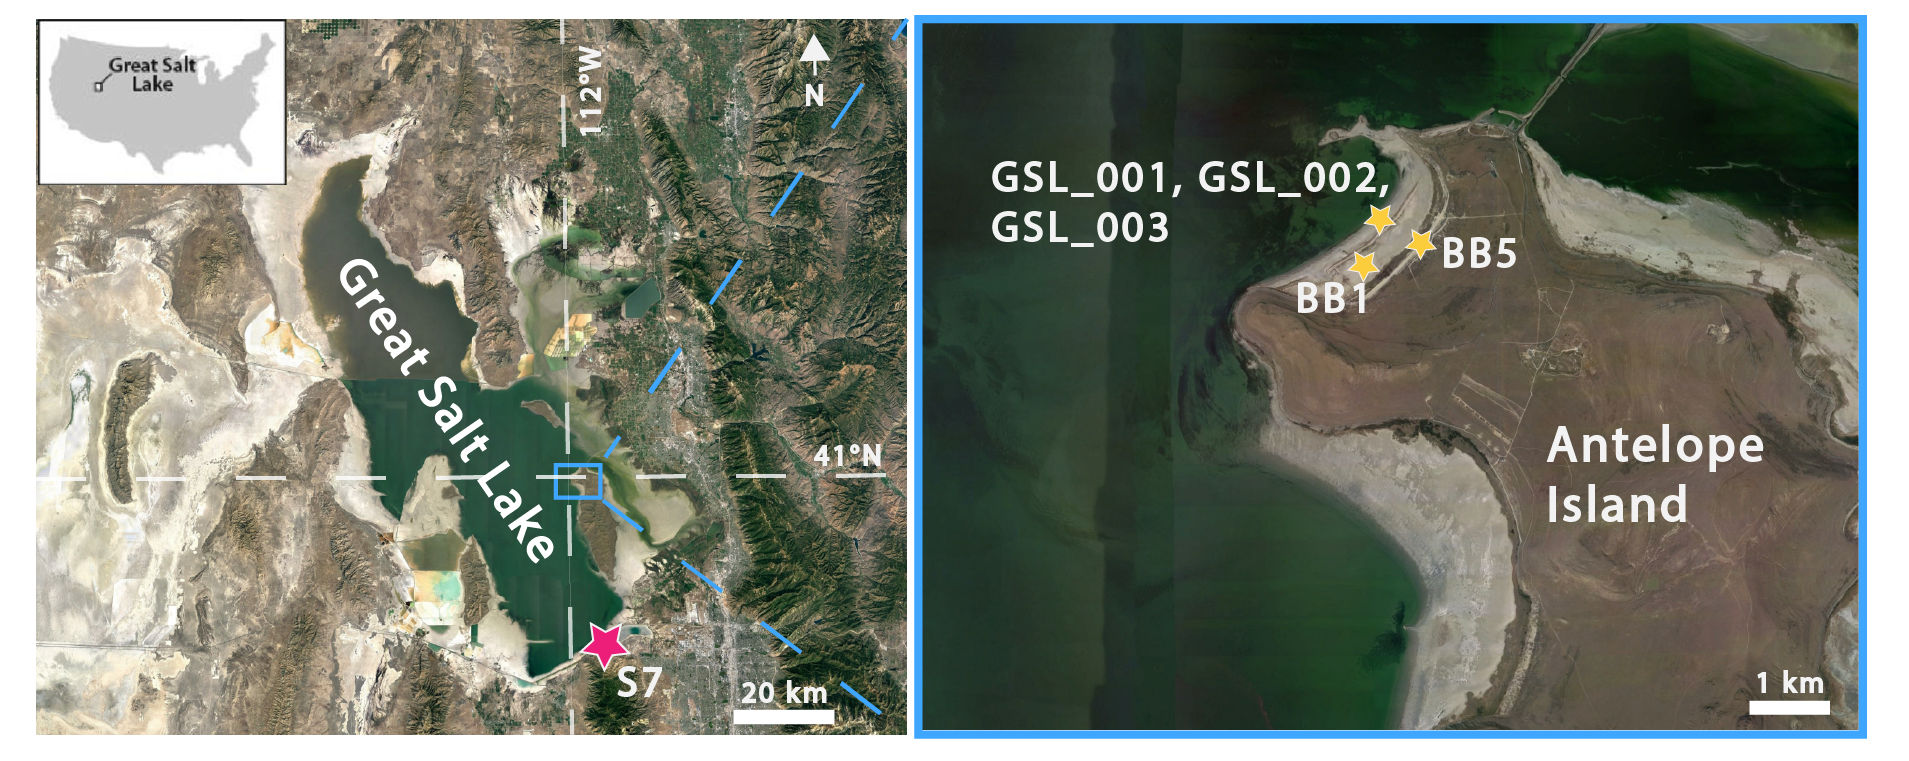
One surface sample of ooid sand were collected at Bridger Bay on the northern end of Antelope Island (Figure 1) in 2015 (GSL001 and subsamples GSL002 sieved to <500 µm and GSL003 sieved to >500 µm; IGSN: IEEJT0001). Three additional samples were collected at Bridger Bay and west of Great Salt Lake State Park in 2017 (BB1, IGSN: IEEJT001A; BB5; S7, IGSN: IEEJT001F) (Figure 1). Each sample were embedded in epoxy and prepared as polished thin sections by Spectrum Petrographics (GSL001, GSL002, GSL003) and High Mesa Petrographics (BB1, BB5, S7). Each thin section was first examined using a polarized transmitted light microscope (Zeiss Axio Imager M2). Raman microspectroscopic analyses were performed using a Horiba LabRAM HR Evolution Spectrometer with a 532 nm excitation laser at the CU Boulder Raman Microspectroscopy Lab. Element maps of cortical fabrics of individual ooids were collected via wavelength-dispersive spectroscopy (WDS) using a JEOL-8230 electron microprobe at the University of Colorado Electron Microprobe Laboratory. Samples were carbon coated and imaged using an accelerating voltage at 15 keV and a beam current of 17.6 nA. Targeted elements included Si (or Al), Mg, Mn, Fe, and Ca. In total, we collected data from 40 ooids. Count ratio maps were created (Ca:Mg and Si:Mg) using the open source image processing program ImageJ. Backscattered electron images of carbon-coated thin sections were collected with a Hitachi SU3500 Scanning Electron Microscope (SEM) in the Colorado Shared Instrumentation in Nanofabrication and Characterization (COSINC) using an accelerating voltage of 10.0 keV and a working distance of ~5 mm.
_overview_map_of_the_great_salt_lake_(gsl)_and_(b)_inset_map_of_bridger_bay_on_antelop.png)
Synchrotron X-ray Microscopy
X-ray fluorescence (XRF) mapping and x-ray absorption near-edge spectroscopy (XANES) were performed at the Stanford Synchrotron Radiation Lightsource (SSRL) at beamline 14-3b. A Si (111) (Φ = 90) double crystal monochromator provided the incident x-ray energy and was calibrated to the thiol pre-edge peak of thiosulfate at 2472.02 eV. The S, Si, Al, and Mg Kα fluorescence lines were measured with a Si Vortex Si drift detector (Hitachi) using Xspress3 pulse processing electronics (Quantum Detectors). The X-ray beam was focused using a Kirkpatrick-Baez mirror pair to ~5×5 μm. Thin sections were placed on a rotating stage within the experimental station hutch and flushed with helium. XRF element maps were created by scanning the sample across the ~5×5 μm beam size to locate the distribution of Si, Mg, and S.
We collected 8 XRF maps. Sulfur K-edge absorption spectroscopy point analyses (spot area of ~5×5 μm) were used to identify sulfur species. Multiple energy maps were collected to examine the spatial distribution of sulfur species by collecting images at a series of indicative energies for the species, S0, at 2472.7 eV and carbonate-associated sulfate (CAS) at 2482.6 eV. We collected 35 spectra. Spatial distribution of the sulfur species was determined using a linear combination methodology. XRF image maps were processed using the MicroAnalysis Toolkit (SMAK) (Webb, 2011). Sulfur K-edge XAS was processed using standard processing methods with the SIXPACK software package, (Webb, 2005). XANES fit standard compounds include: CAS in aragonite, CAS in calcite, glutathione, glutathione disulfide, gypsum, various kerogens, pyrite, S0, S8, SO4, SO4 ester, sulfonate and sulfoxide.
Carbonate-Associated Sulfate Analyses
Water soluble sulfate phases were leached from 2–3 mg of crushed ooids before dissolution in 0.5N distilled HCl following (Present et al., 2015). Sulfate was purified from the acid soluble fraction by anion exchange chromatography following (Paris et al., 2014). CAS concentrations were determined from the acid soluble mass of ooids, and the sulfate amount determined by ion chromatography on a Thermo Scientific Dionex ICS-3000 using an IonPac AS-29-Fast-4 µm 2×150 mm analytical column with an IonPac AG29-Fast-4uM 2×30 mm guard column and 4.5 mM Na2CO3/2.0 mM NaHCO3 eluent at 0.25mL/min flow suppressed by an AERS500 2 mm carbonate suppressor. Sulfur isotope ratios were determined by sample-standard bracketing of matrix-matched 20 µM Na2SO4 solutions on a Thermo Fisher Scientific Neptune Plus multicollector inductively coupled plasma mass spectrometer with a Cetac Aridus II desolvating nebulizing system following (Paris et al., 2013).
Results
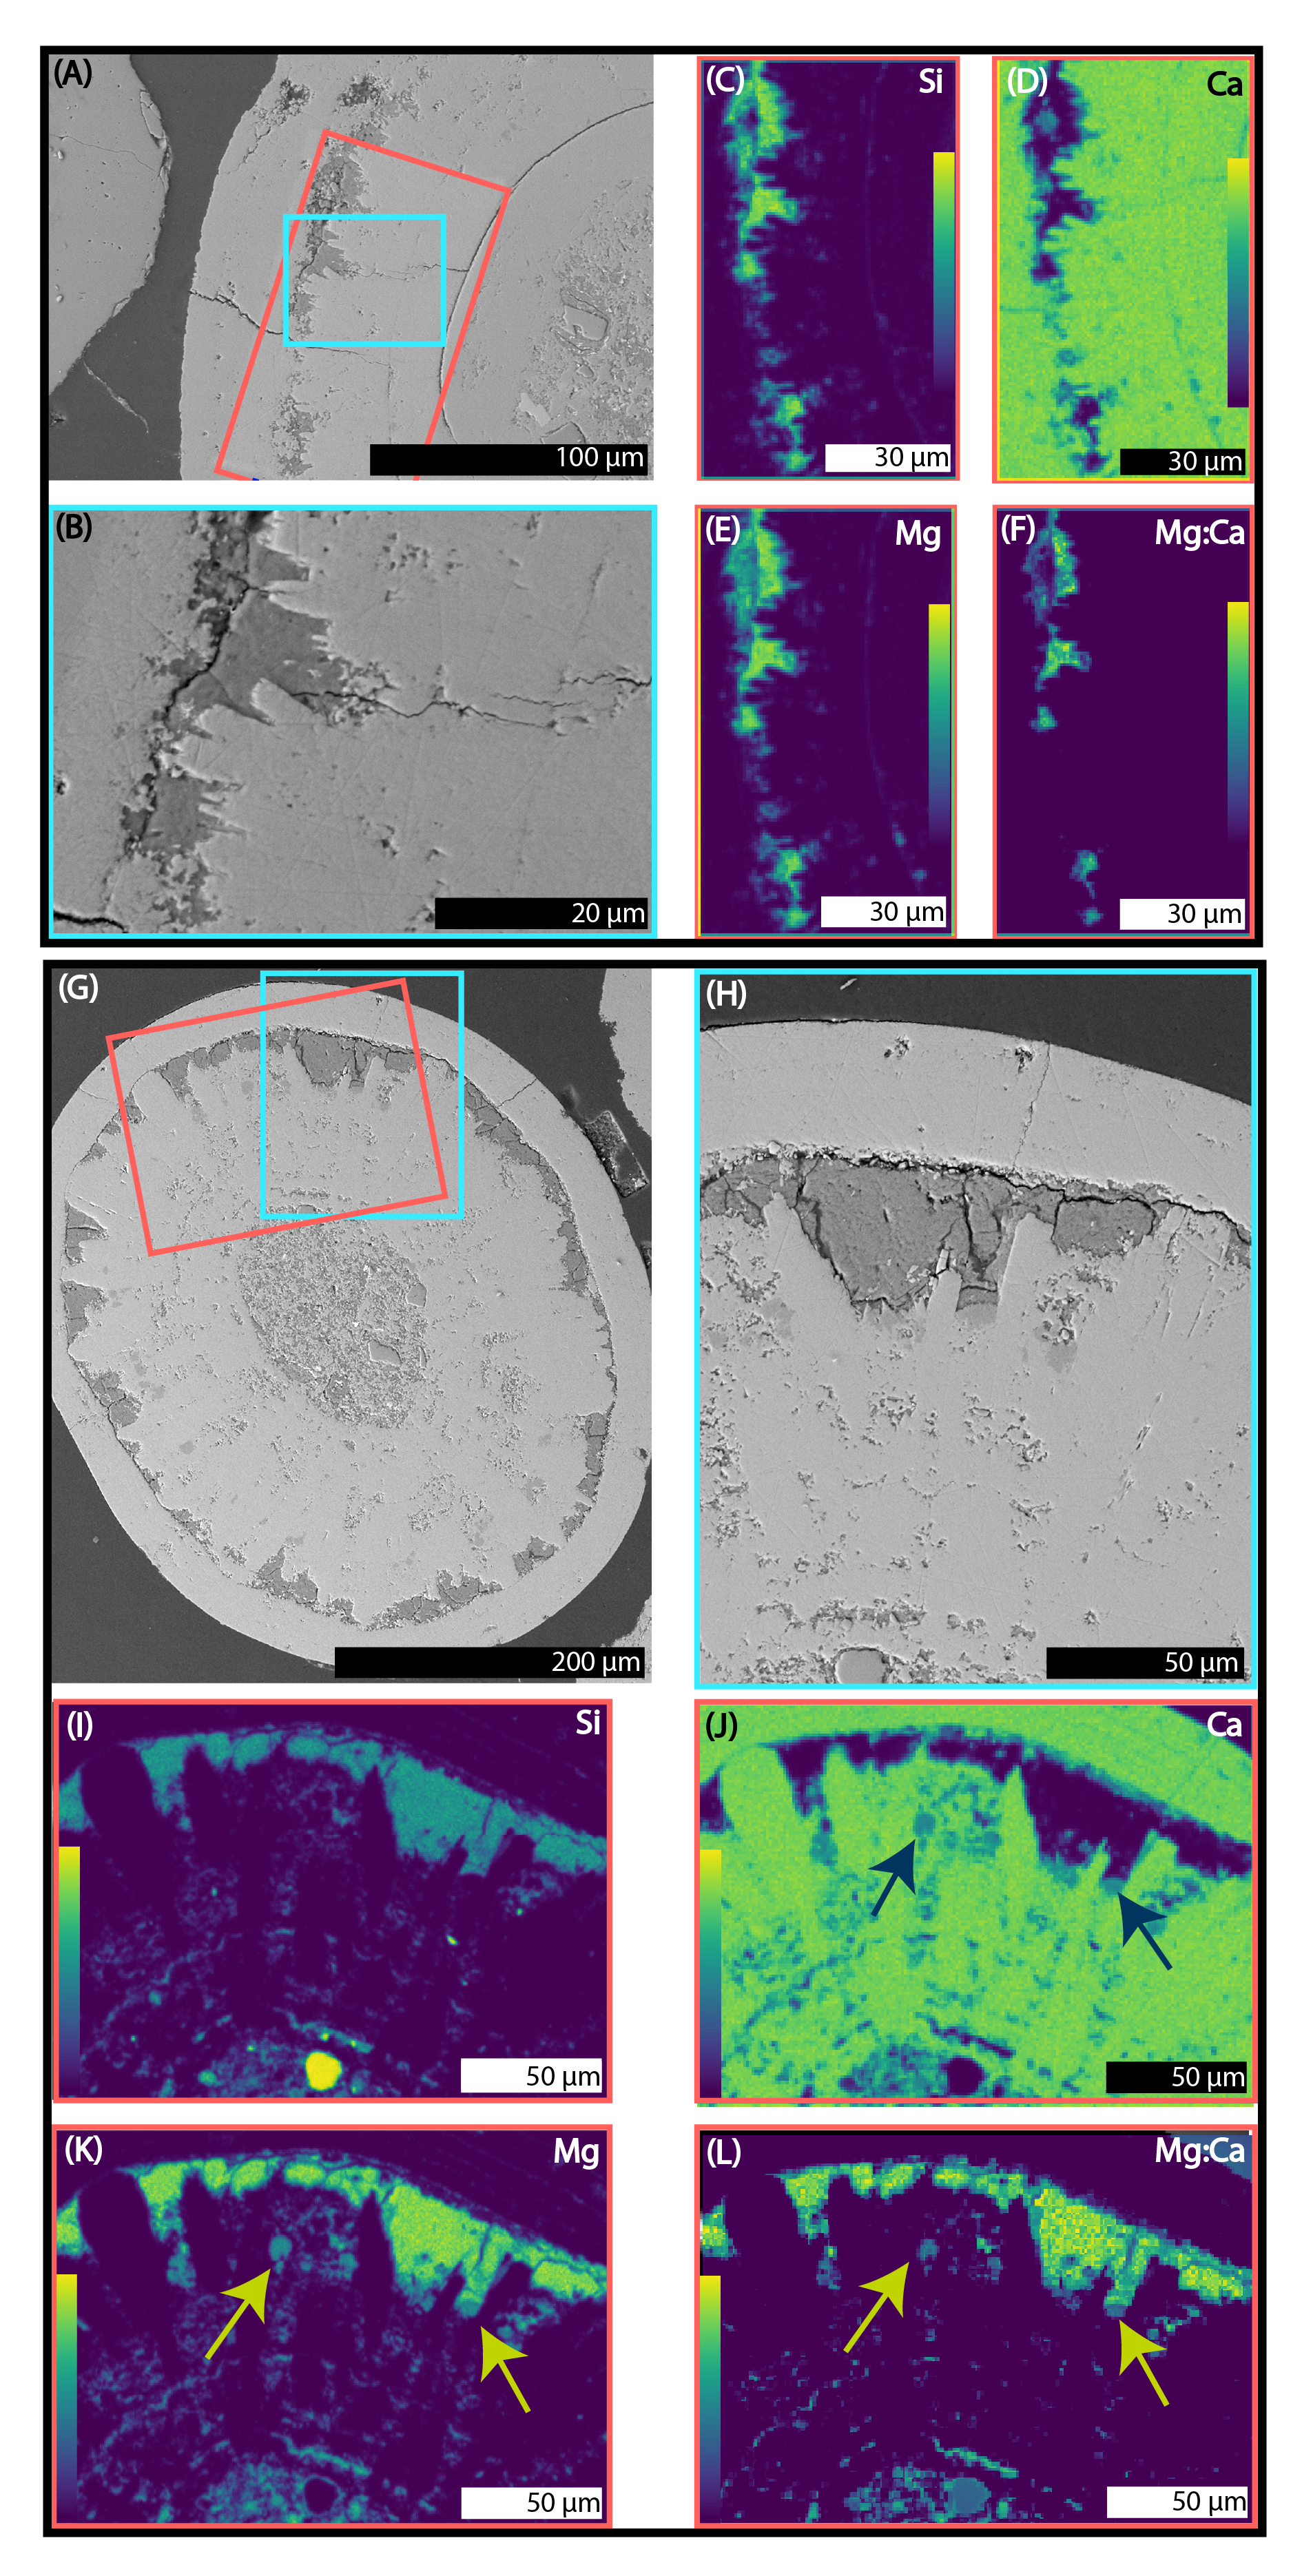
Ca, Mg, and Si were found ubiquitously in all sampled ooid cortices (Figure 2). Spatial distributions of Mg and Si closely corresponded, while Ca distributions were notably anticorrelated with both Mg and Si, with some exceptions (discussed further below). Al was not observed in these zones (Figure S4). The Mg-Si phase displayed a strong fluorescence when examined via Raman microspectroscopy (Figure S3), which is characteristic of clay minerals (Kloprogge, 2016).

Zones characterized by abundant Ca, but near-background levels of Mg and Si were identified as aragonite via Raman microspectroscopy, consistent with previous work (Kahle, 1974; Sandberg, 1975). Ca and Mg did not appear to co-occur (Figure 2L), except for a few small areas in a subset of the grains examined. The methods used did not permit the determination of whether this phase was dolomite or high-Mg calcite. These zones containing both Ca and Mg were found in small enclaves no larger than 5 μm across situated in between aragonite and Mg-silicate phases or surrounded by aragonite (Figures 2I, 2J, 2L). Aragonite crystals appear to range in length and morphology (from 1 μm to 50 μm). Large euhedral crystals radially protrude outward toward the grain surface into zones of Mg-silicate (Figure 2) or traverse laminar boundaries (Figure S1). Smaller euhedral aragonite crystals commonly completely encompass and protrude into Mg-silicate zones (Figures 2A–F, S2).
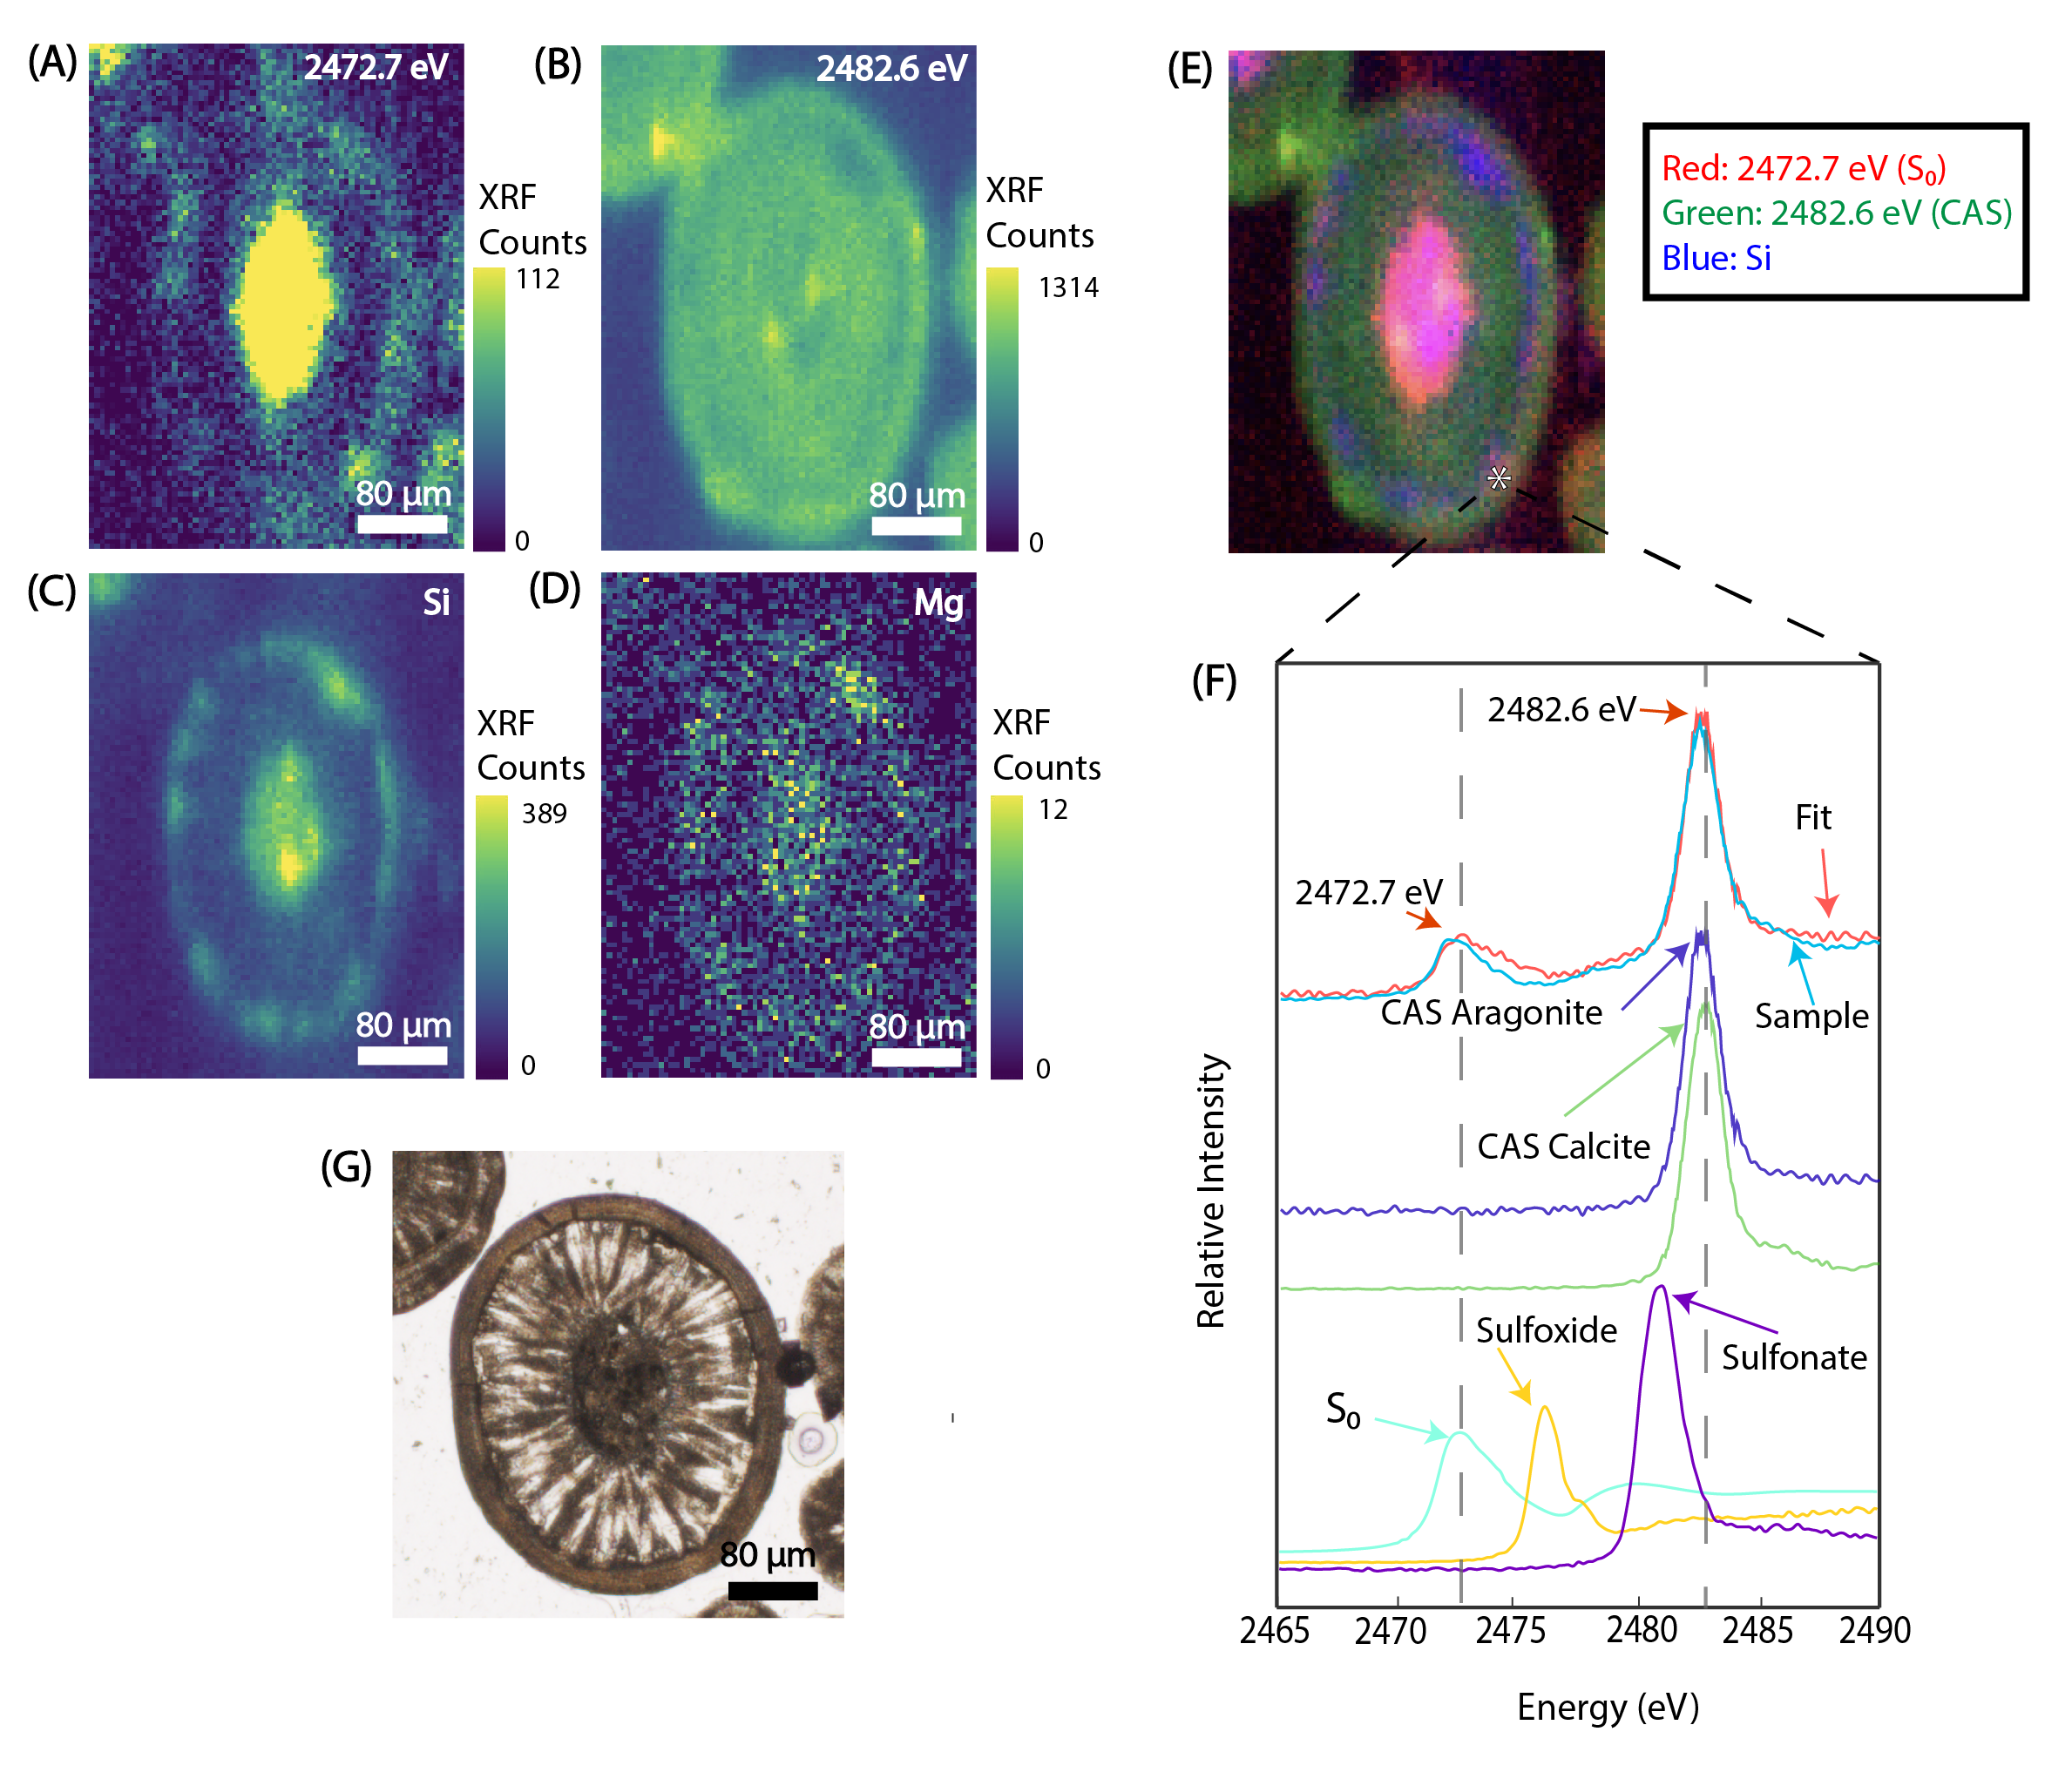
Synchrotron K-edge XAS data revealed multiple sulfur species contained within sample fabrics. The two dominant phases present were S0 at 2472.7 eV and carbonate associated sulfate (CAS) at 2482.6 eV (Figure 3). Multiple-energy XRF maps revealed that S0 spatially corresponded with Mg-silicate zones (Figure 3), whereas CAS was widely distributed across ooid cortices and generally corresponded with the distribution of aragonite.
_2472.7_ev_(interpreted_as_s_0_)__(b)_2482.6_ev_(interprete.png)
Although GSL ooids are composed of aragonite, we found that the CAS peak in our spectra was best fit by a combination of aragonite and calcite CAS spectra (Figure 3F). Slight changes (<0.5 eV) in the energy of maximum sulfate absorption intensity reflect distortion of the sulfate tetrahedron (Richardson et al., 2019). Several factors may force asymmetries between S-O bonds and result in a lower excitation energy: increasing CAS concentrations in carbonate, differences in the lattice environment between low-Mg calcite, high-Mg calcite, and aragonite, or other imperfections or impurities in the carbonate lattice. We interpreted that the position of our CAS peak was likely influenced by the high CAS concentrations in our samples, which ranged from 6747.6 – 8440.0 ppm (Table 1).
Discussion
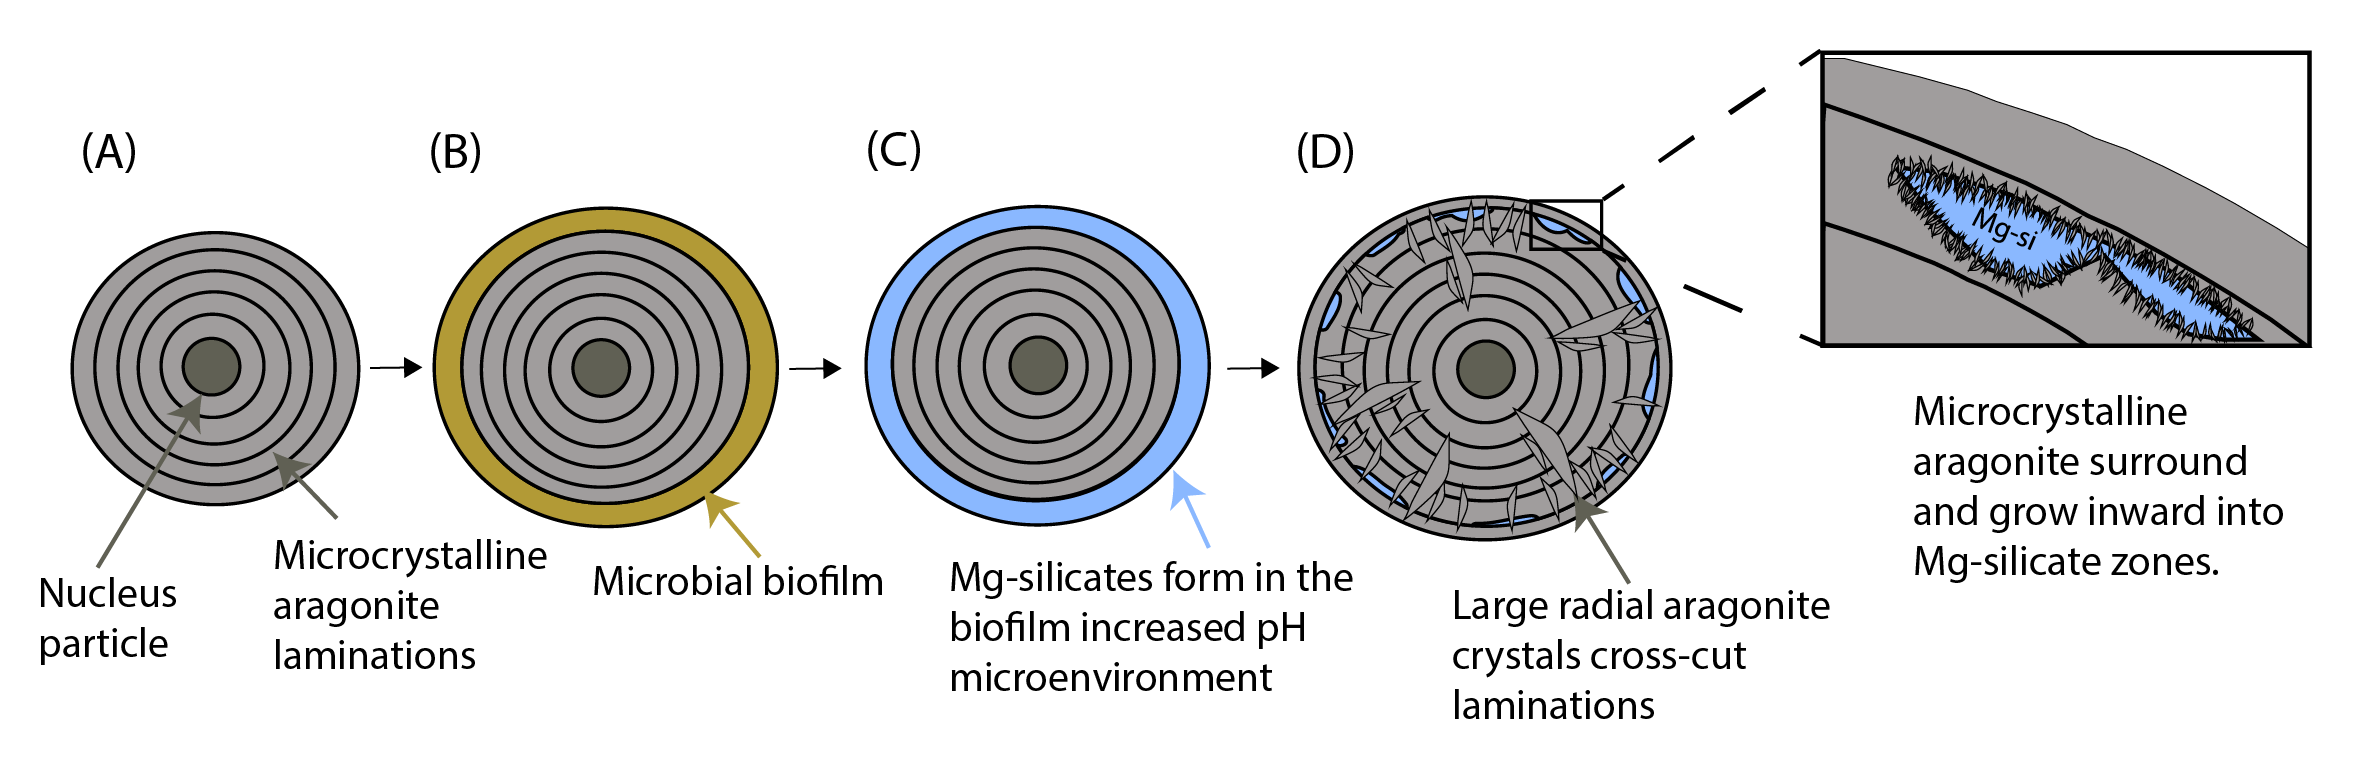
Areas of euhedral aragonite crystals protruding into areas of Mg-silicate (Figure 2) were common in many of the ooids we examined. The apparent cross-cutting arrangement of these aragonite crystals through the tangential laminations (Figures 4D, S1) and growing into zones of Mg-silicate (Figures 2 and S2) is characteristic of automorphic penetration, where one mineral clearly cuts across one mineral boundary into another.

Similar patterns of replacement of finely laminated primary fabrics by coarser radial fabrics via neomorphism have been noted in modern laminated freshwater travertine and stromatolites (Freytet & Verrecchia, 1999). Souza-Egipsy et al. (2005) also documented euhedral calcium carbonate fringes growing into and replacing Mg-silicate zones in tufa sand sediment from Mono Lake, California; in these examples, the replacing carbonate clearly crosscuts and overprints primary microfabric of cyanobacterial sheaths mineralized by Mg-silicate. Our observations demonstrate that, at least in the cases observed here, the ubiquitous radial fabric in GSL ooids is not a primary fabric. Instead, we interpret that the radial fabric has been at least enhanced (and in some cases entirely created) via automorphic penetration and neomorphic replacement of primary cortical layers composed of aragonite and Mg-silicate.
Importantly, our observations do not imply that that aragonite is exclusively a secondary mineral in GSL ooid cortices, but rather that the microfabrics within ooid cortices have altered during the ~6000 years over which modern GSL ooids have been forming (Paradis, 2019). If our interpreted paragenetic sequence (Figure 4) is correct, the canonical interpretation that radial microfabrics in ooid cortices reflect formation in relatively low energy environments—which is based on GSL ooids as a case example—must be revisited.
We hypothesize that microbial sulfur cycling directly enables Mg-silicate formation in GSL, promoting mineral formation by locally raising pH beyond the experimentally demonstrated threshold (Tosca et al., 2011). This hypothesis is supported by our data, which reveals that distributions of Mg-silicate and S0 within GSL ooids are nearly identical. Cyanobacterial photosynthesis and passive organomineralization through the degradation of EPS are also known to contribute to the precipitation of Mg-silicate minerals, however these mechanisms do not account for the co-occurrence of S0 with Mg-silicates (Pace et al., 2016; Pacton et al., 2012). We interpret that this S0 is a residual intermediate phase from microbial sulfur-cycling—in other words, a fingerprint of microbial metabolic activity that could enable local Mg-silicate precipitation. Therefore, we conclude that the Mg-silicates within the cortices of GSL ooids represent a phase formed exclusively through a microbially-mediated mechanism.
Mg-silicates have been documented in other ancient lacustrine carbonates. For example, a dark brown “coffee ground” oolite bed in the Eocene Green River Formation in the Sanpete Valley is composed of stevensite (Tettenhorst & Moore, 1987), a tri-octahedral Mg-silicate clay mineral that only forms in waters with pH >9 and high Mg concentration (Jones, 1986; Wright, 2012). Mg-silicates are also common within the lacustrine carbonates of the Cretaceous Pre-Salt Barra Velha Formation of the South Atlantic Santos Basin (Wright & Barnett, 2015) and appear to co-occur with carbonates in Jezero Crater on Mars (Horgan et al., 2020). While formation in high pH lake waters has been considered the most likely formation mechanism for these Mg-silicates, our work demonstrates that microbial mediation in more moderate pH conditions is another plausible pathway. Identifying co-occurrence of Mg-silicate and S0 (or other metabolic intermediates of sulfur cycling) may provide a useful biosignature for these ancient examples. Future work identifying the maximum pH offset at which microbial metabolic activity can still drive Mg-silicate precipitation could also enable presence/absence of Mg silicates in lacustrine carbonate stratigraphy to provide insights into shifts in lake water pH.
All data related to this work are available in an Open Science Framework repository: doi://10.17605/OSF.IO/4VWZA.
ACKNOWLEDGMENTS
We thank Eric Ellison, Aaron Bell, and Tomoko Borsa for assistance with Raman microspectroscopy, electron microprobe, and SEM, respectively. This research was supported in part by the Colorado Shared Instrumentation in Nanofabrication and Characterization (COSINC), RRID:SCR_018985. Use of the Stanford Synchrotron Radiation Lightsource, SLAC National Accelerator Laboratory, is supported by the U.S. Department of Energy, Office of Science, Office of Basic Energy Sciences under Contract No. DE-AC02-76SF00515. The SSRL Structural Molecular Biology Program is supported by the DOE Office of Biological and Environmental Research, and by the National Institutes of Health, National Institute of General Medical Sciences (P30GM133894). The contents of this publication are solely the responsibility of the authors and do not necessarily represent the official views of NIGMS or NIH.