


INTRODUCTION
Submarine-channel systems carry significant volumes of sediment into the deep ocean and their deposits provide a detailed record of Earth history (Hubbard et al., 2014). These sediment accumulations are a target for hydrocarbon exploration and a focus for paleoclimate research because of their preservation potential within the sedimentary record (Hessler & Fildani, 2019). Seismic-reflection data help visualize large-scale geometries of submarine-channel deposits, and the ability to collect sediment samples in extreme water depths allows researchers to investigate fine details within large depositional systems. Scientific voyages are expensive, however, and bridging the gap between large and small scales of investigation is difficult within the limits of data collection. Outcrop studies allow geologists to make fine-scale observations of continuous sediment packages, allowing characterization of heterogeneity at multiple scales and thus remain the foundation of deep-water sedimentology research. However, data collection is often limited by the location and quality of the exposure. Unmanned aerial vehicles (UAVs) allow aerial viewpoints that are difficult to see from the ground, and 3D outcrop models (Englert et al., 2021; Nesbit et al., 2021; Nieminski & Graham, 2017) allow bed correlation across inaccessible cliff faces and more accurate channel architecture and dimensional measurements (Jackson et al., 2019).
Recent studies have focused on reconstructions of channel dimensions and facies architecture in outcrop datasets that are oriented oblique to paleoflow (Bell et al., 2020; Casciano et al., 2018; Englert et al., 2021; Hubbard et al., 2014, 2020; Jackson et al., 2019; Nesbit et al., 2021). In addition to these case studies, data compilation efforts by Cullis et al. (2019) provide ranges of channel dimensions within a reproducible stratigraphic hierarchy based on bounding stratigraphic surfaces (Cullis et al., 2018; Hubbard et al., 2014). Of particular importance is the surface and facies architecture near the edges of channel deposits, where thick-bedded amalgamated sandstones transition to thinly-bedded sandstone-mudstone couplets (Mutti & Normark, 1987). The detailed 3D architecture at this transition strongly affects reservoir connectivity within and between channel deposits (e.g., Alpak et al., 2013; Jackson et al., 2019; McHargue et al., 2011; Meirovitz et al., 2021).
This study integrates UAV technology and traditional field methods to document channel-element dimensions, orientation, and vertical and lateral facies architecture in a 1400 meter long, continuous outcrop in the Miocene Modelo Formation, California. The unique exposure in both strike and dip orientations allows for detailed characterization of the internal facies transitions within a single channel element, particularly the axis-to-margin facies architecture. Through comparison with a modern-seafloor channel, this study provides valuable insights into the 3D connectivity of submarine-channel deposits.
STRATIGRAPHIC HIERARCHY OF SUBMARINE-CHANNEL ELEMENTS
Many schemes have been proposed to describe the depositional architecture and component hierarchy of submarine channelforms (e.g., Cullis et al., 2018; Mutti & Normark, 1987, and references therein). The terms storey, channel element, and channel complex are herein used to describe component hierarchy in outcrop datasets, which are organized by the erosional surfaces that bound each sedimentary package (sensu Hubbard et al., 2014, 2020). Storeys are intrachannel features that are bounded by localized ‘secondary channelform surfaces’ (Hubbard et al., 2014). Channel elements are sedimentary packages bounded by ‘primary channelform surfaces’ (Hubbard et al., 2014) and often contain several storeys. Channel elements are inferred to most closely represent the deposit from a geomorphic channel on the seafloor, and typical dimensions of channel elements are several hundred meters wide and 10-20 meters thick (Cullis et al., 2019). Submarine-channel complexes are large sedimentary packages that contain multiple channel elements, commonly characterized in outcrop (e.g., Macauley & Hubbard, 2013) and seismic-reflection datasets (e.g., Janocko et al., 2013).
The terms axis, off-axis, and margin (Fildani et al., 2013; Hubbard et al., 2014; McHargue et al., 2011; Sullivan et al., 2000) are used to describe the position within a channel element and are assigned based on facies characteristics such as grain size, amalgamation, and the ratio of sand to mud (i.e., net-to-gross ratio). The axis is the sand-rich, amalgamated, central portion of the channel element, where the highest energy conditions existed during sediment deposition or bypass (Bell et al., 2020; Hubbard et al., 2014). Off-axis represents the area adjacent to the axis, where amalgamated sandstones pinch out and erosional surfaces and mudstones are common due to varying depositional energy. The margin represents the deposits along the edges of the channel element, where thin mudstones and sandstones are often preserved (Mutti & Normark, 1987; Paull et al., 2005). The margin and axis are typically separated by secondary-channelform surfaces (Hubbard et al., 2020).
GEOLOGIC SETTING
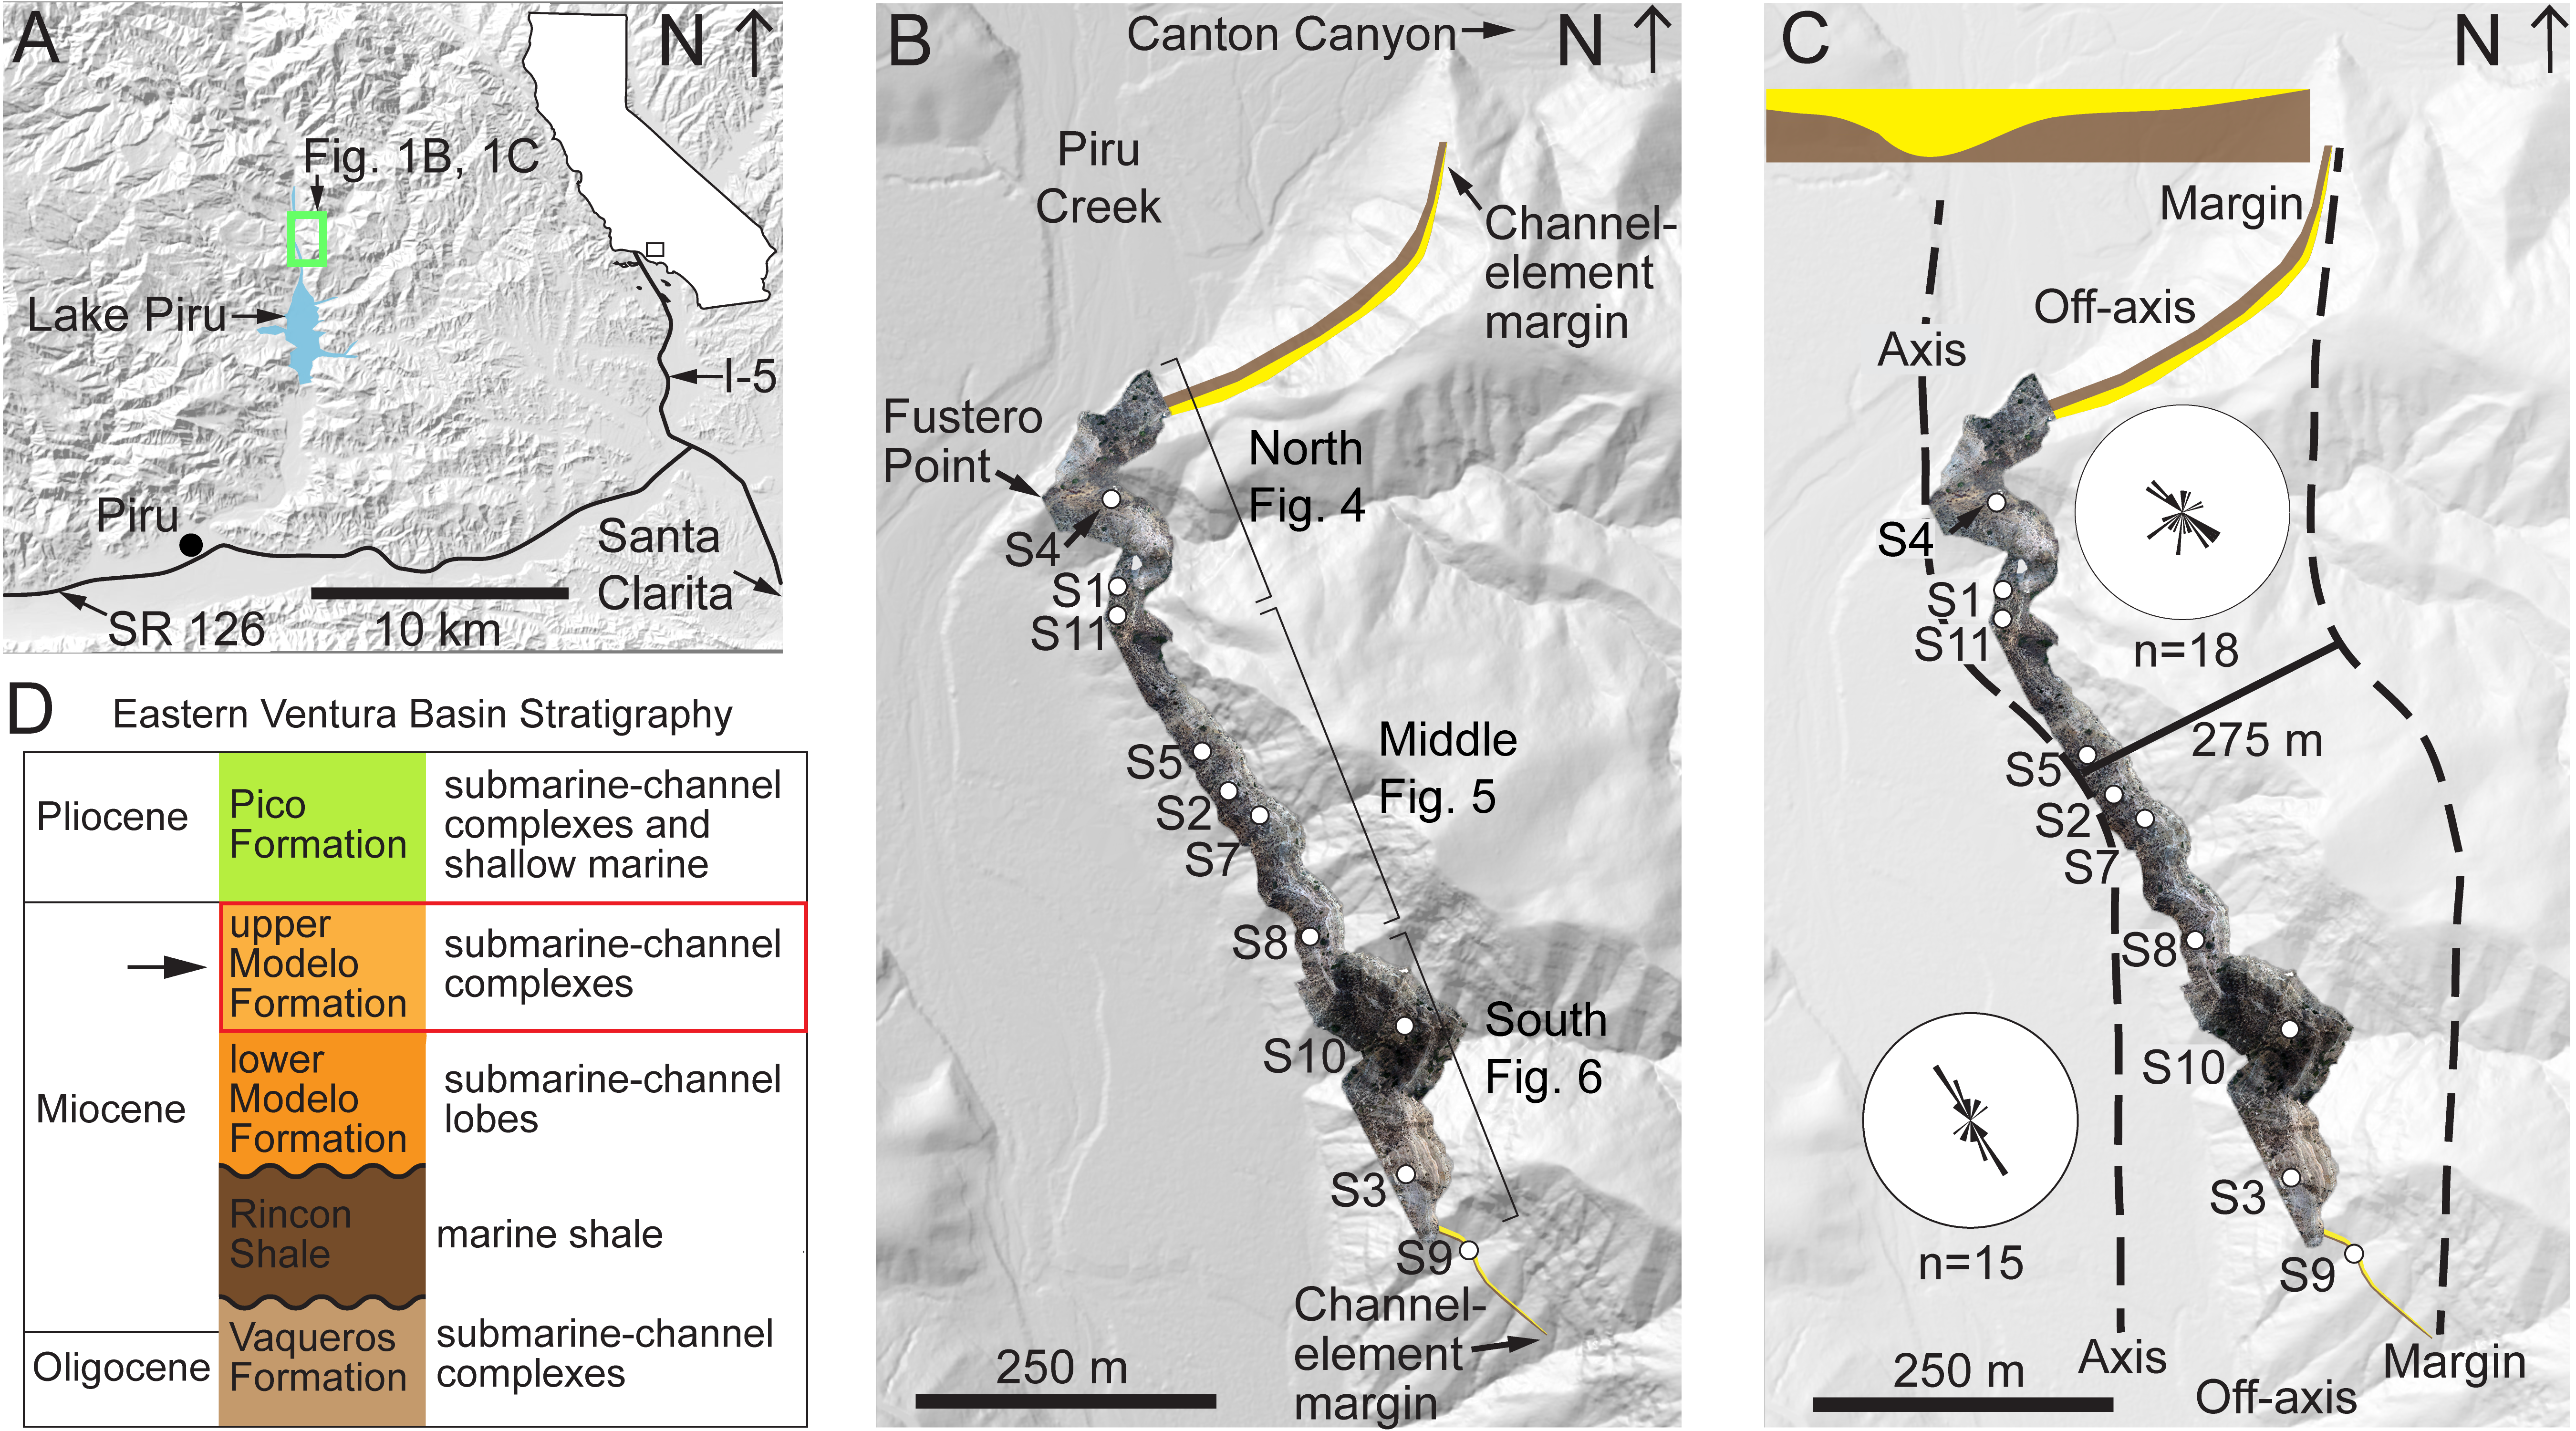
The Miocene Modelo Formation is up to 2500 m thick and consists of 10-80 m thick turbiditic sandstone and mudstone packages intercalated with siliceous shales (Dibblee et al., 1989). The age of the upper Modelo Formation is 13.9-7.5 Ma based on biostratigraphic data (Yeats et al., 1994). In the eastern Ventura Basin, California, the Modelo Formation lies unconformably above the marine deposits of the Miocene Rincon Shale (Fig. 1D) and is overlain by the turbidites and shallow marine deposits of the Pliocene Pico Formation (Yeats et al., 1994).

The upper Modelo Formation was deposited along the eastern margin of the Ventura Basin (Fig. 1B), a rapidly subsiding Miocene pull-apart basin formed by extension and rotation of the Western Transverse Ranges (Rumelhart & Ingersoll, 1997). The Ventura Basin is bound to the east by the right-lateral San Gabriel transform fault, which juxtaposed the submarine-fan deposits of the Modelo Formation with terrestrial source areas to the east (Gilbert et al., 2021; Yeats et al., 1994). The depositional environment is analogous to the modern Inner Continental Borderlands off the coast of California, where river systems deliver sediment across narrow continental shelves into submarine canyons (Covault et al., 2007). The continental margin was a nutrient-rich upwelling zone at the time of Miocene deposition (Ingle, 1981), with basinal depositional rates of 7-300 m/m.y. (Pisciotto & Garrison, 1981). Yeats et al. (1994) interprets that the Modelo Formation is partially contemporaneous to the diatomaceous Monterey Formation in the western Ventura Basin (i.e., Santa Barbara Channel), and similar siliceous shales are common within the Modelo Formation.
Previous studies interpret the Modelo Formation as part of the Piru submarine-fan system in the eastern Ventura Basin (Dibblee et al., 1989; Rumelhart & Ingersoll, 1997; Yeats et al., 1994). Gordon (2014) and Gordon and Pyles (2019) interpret that the sediments of the Modelo Formation moved through a 5-7 km long submarine canyon and were deposited in a submarine fan located in a narrow, structurally controlled basin. The channelforms that outcrop at Lake Piru (Fig. 1) widen significantly up section, leading Gordon and Pyles (2019) to interpret them as unconfined channel elements deposited in a submarine canyon-to-basin floor transition zone. This study documents grain-size and facies heterogeneity in a 1400-m long outcrop of a submarine-channel element within the upper Modelo Formation that is exposed 5 km north of the Lake Piru dam (Fig. 1A; also see Fig 10C of Gordon & Pyles, 2019).
METHODS
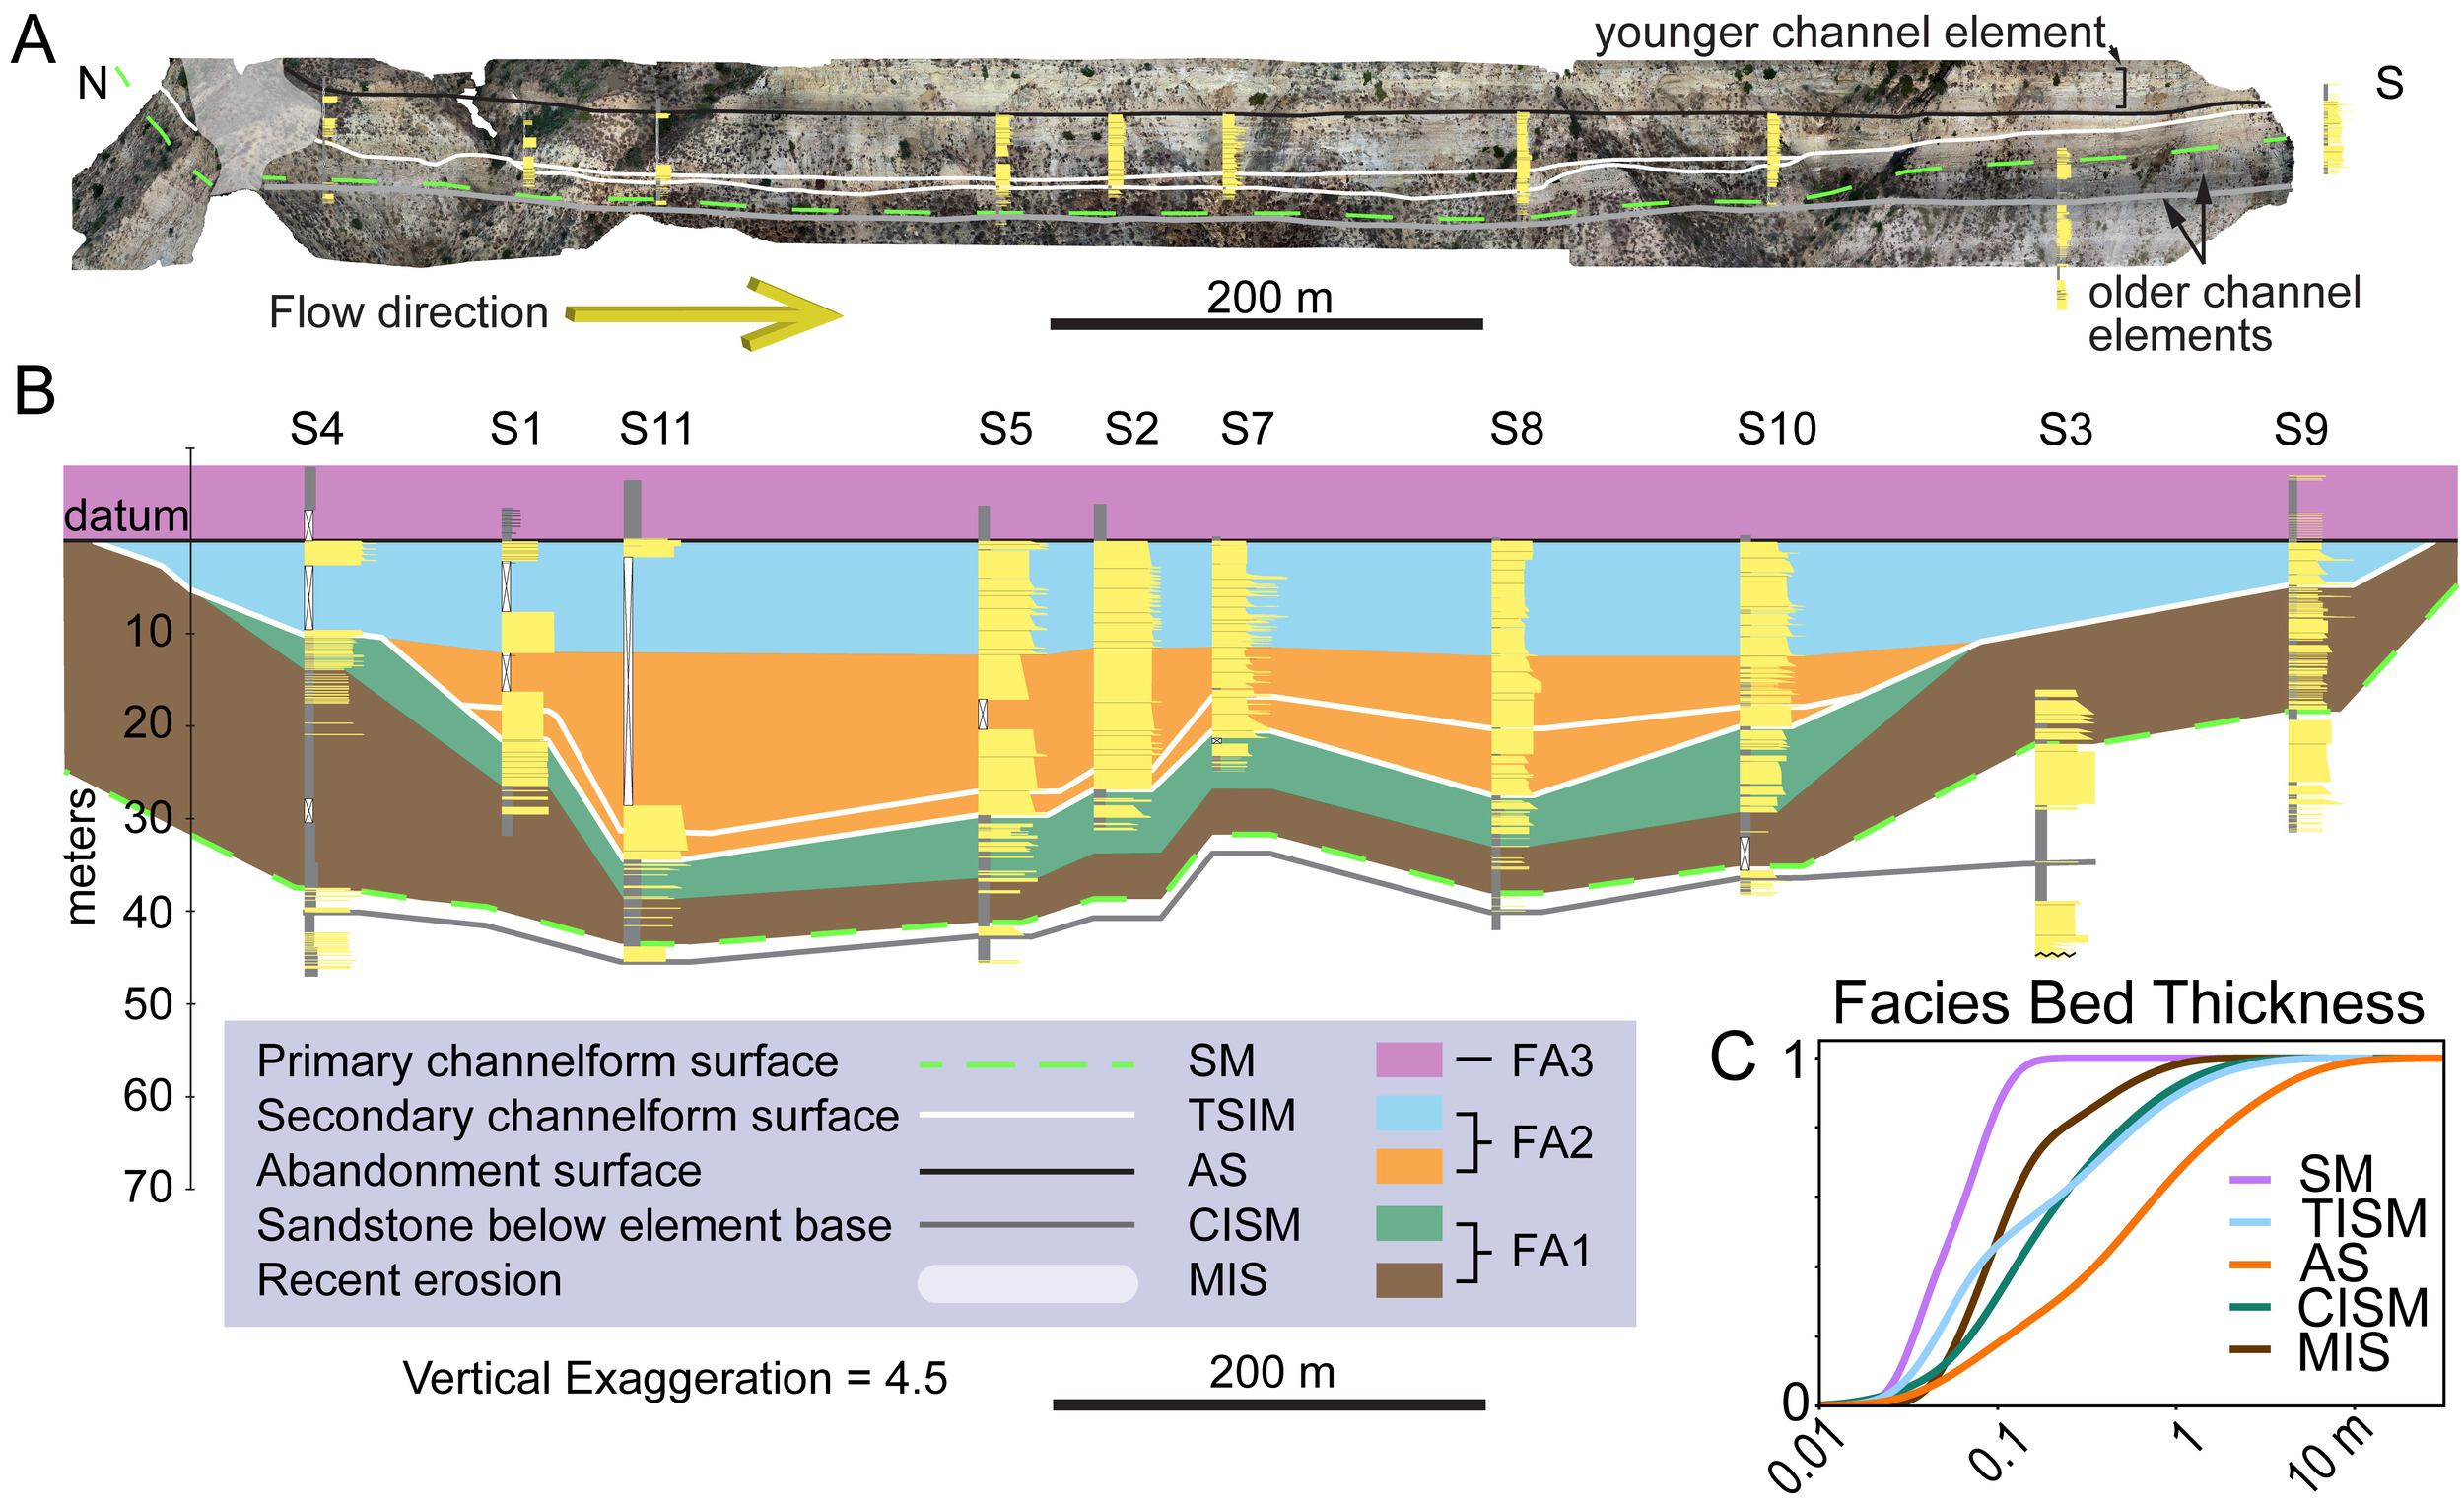
Ten stratigraphic sections (Fig. 1C) were measured from the mudstone facies below the channelform to the top of the sandstone units, where they were accessible. Bed thickness and grain size were measured for each bed larger than 0.05 m and digitized using methods described by Jobe et al. (2021). We recorded 33 paleocurrent indicators from flute casts, tool marks, ripples and parting lineations and these data are plotted on rose diagrams (Fig. 1C). One well exposed flute cast and six ripples indicate that the paleocurrent direction was to the south. The other readings do not have clear unidirectional-current indicators (e.g., a tapered flute cast) and are plotted as bidirectional data. The upper 1-3 m of sections 2, 5, 7, 8 and 10 were inaccessible, so the bed thickness and grain size were visually estimated in the field.
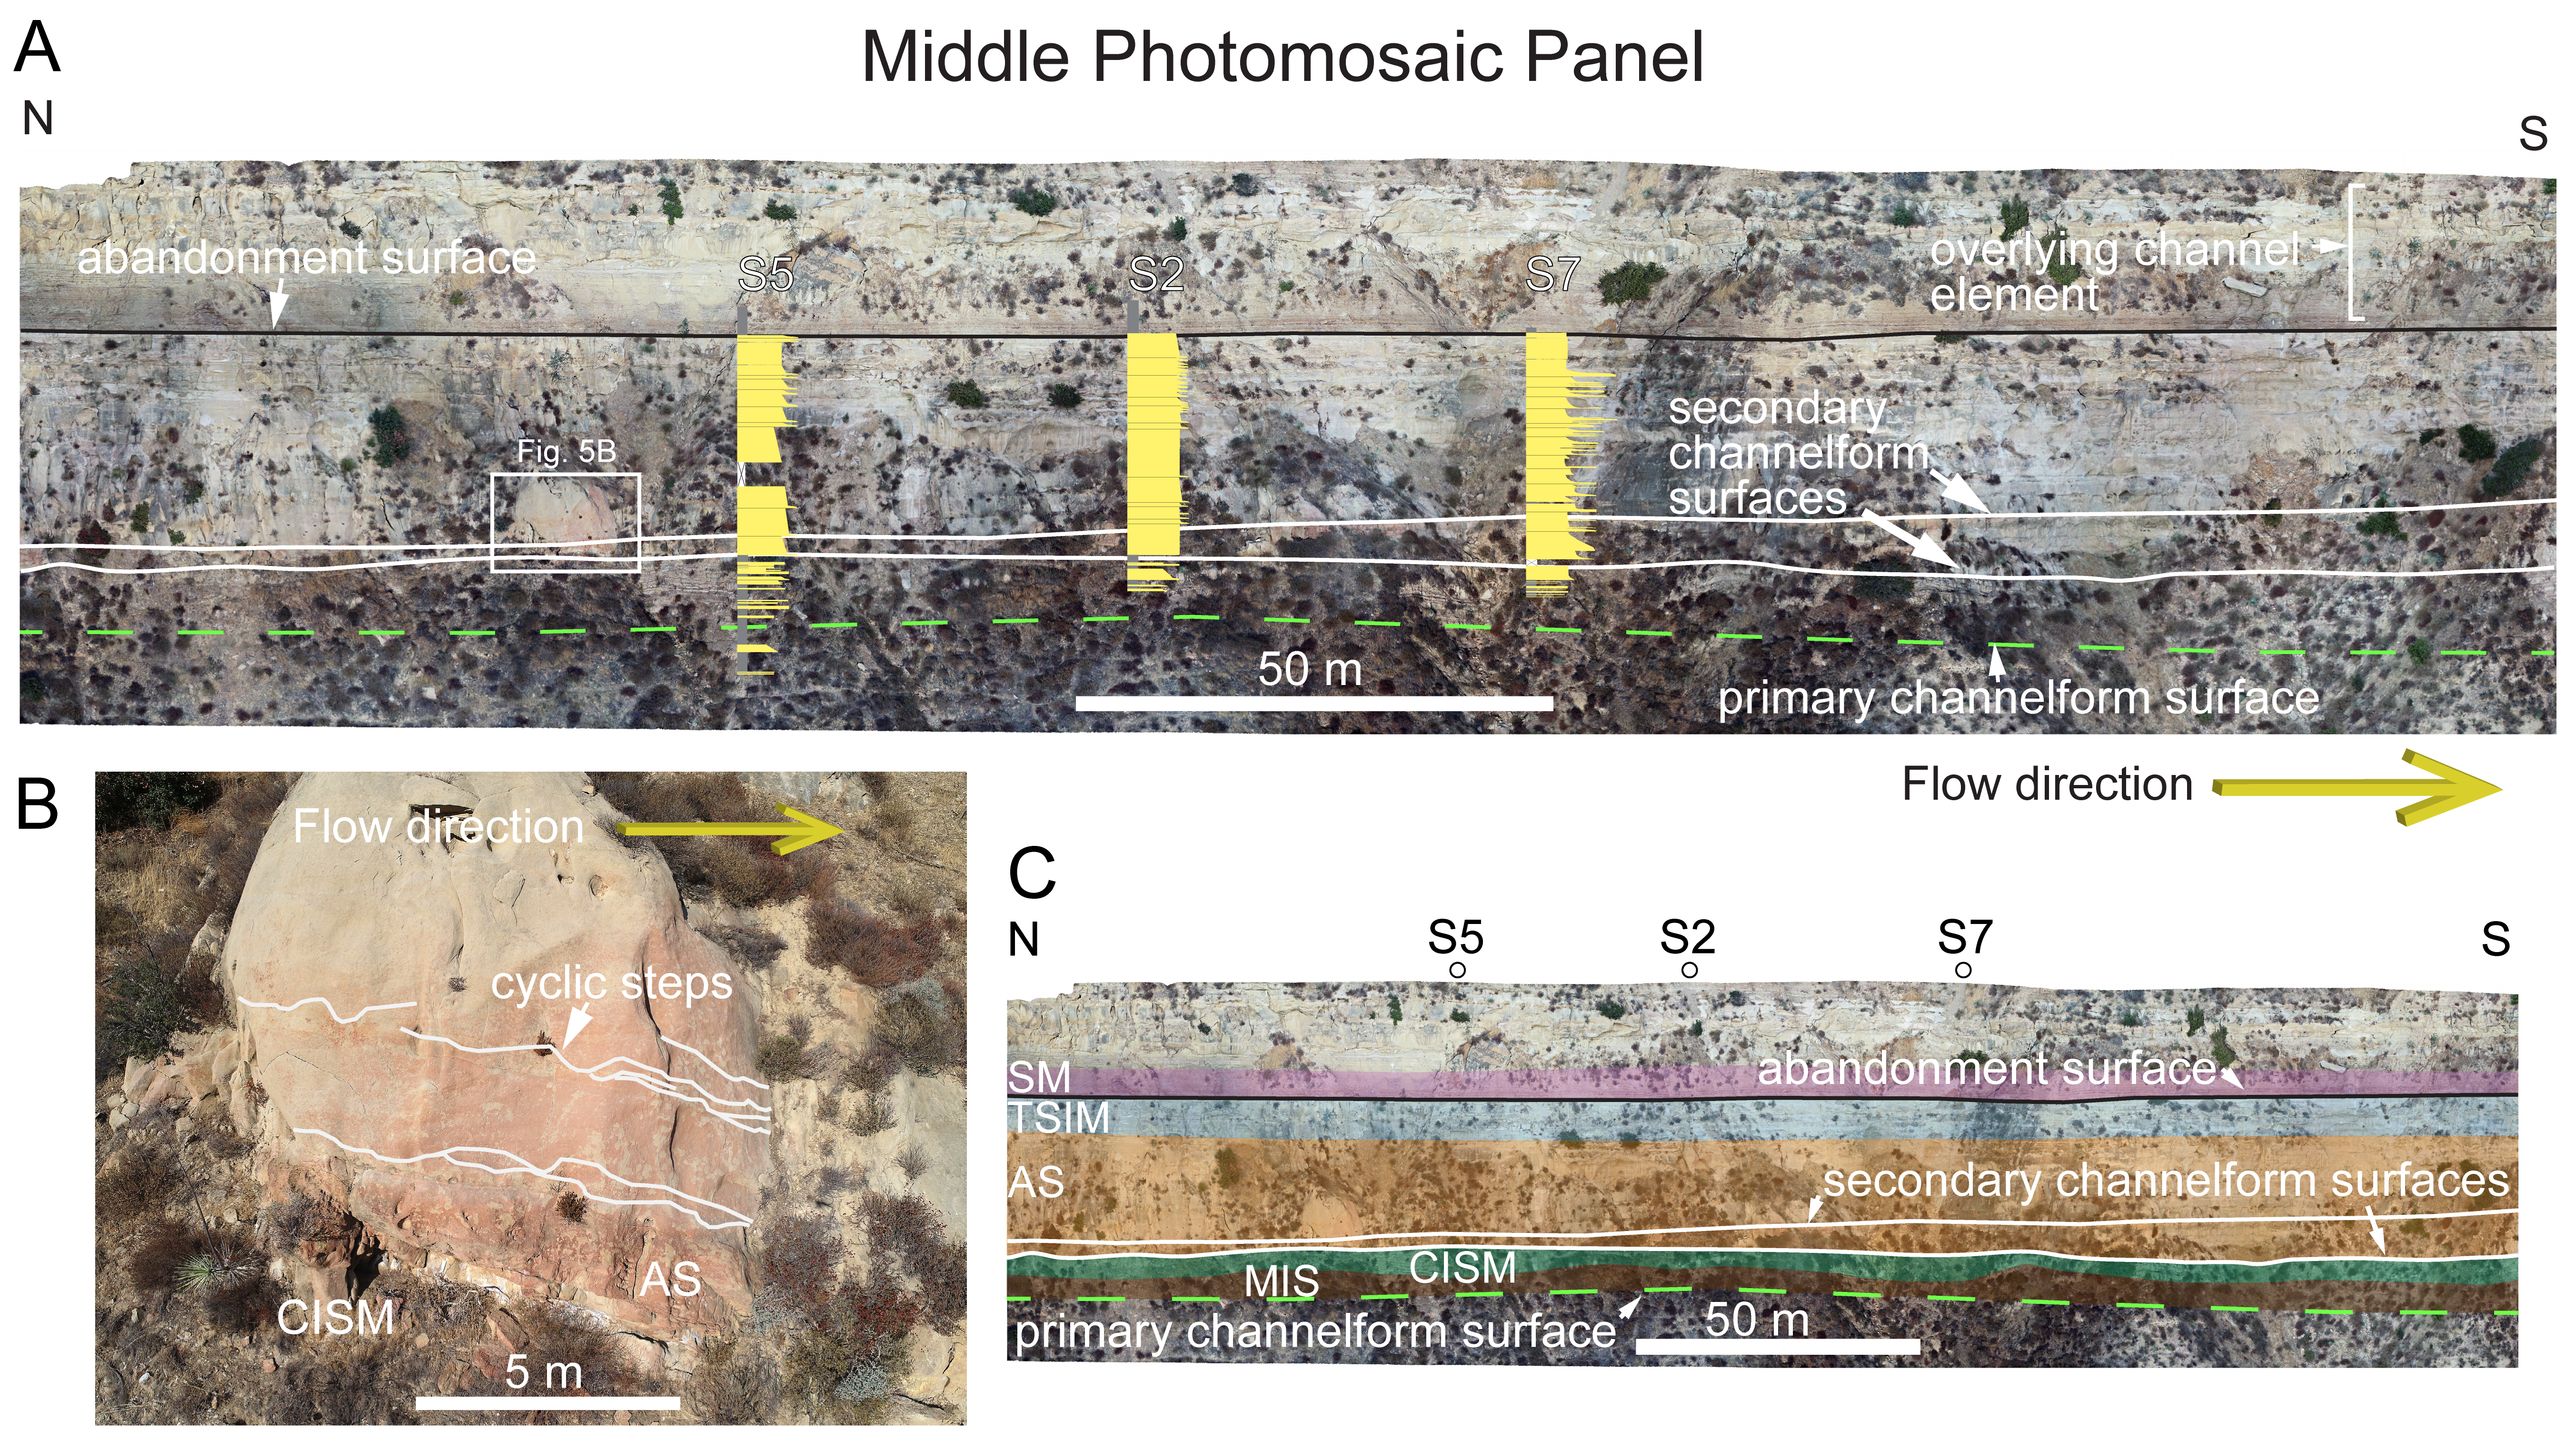
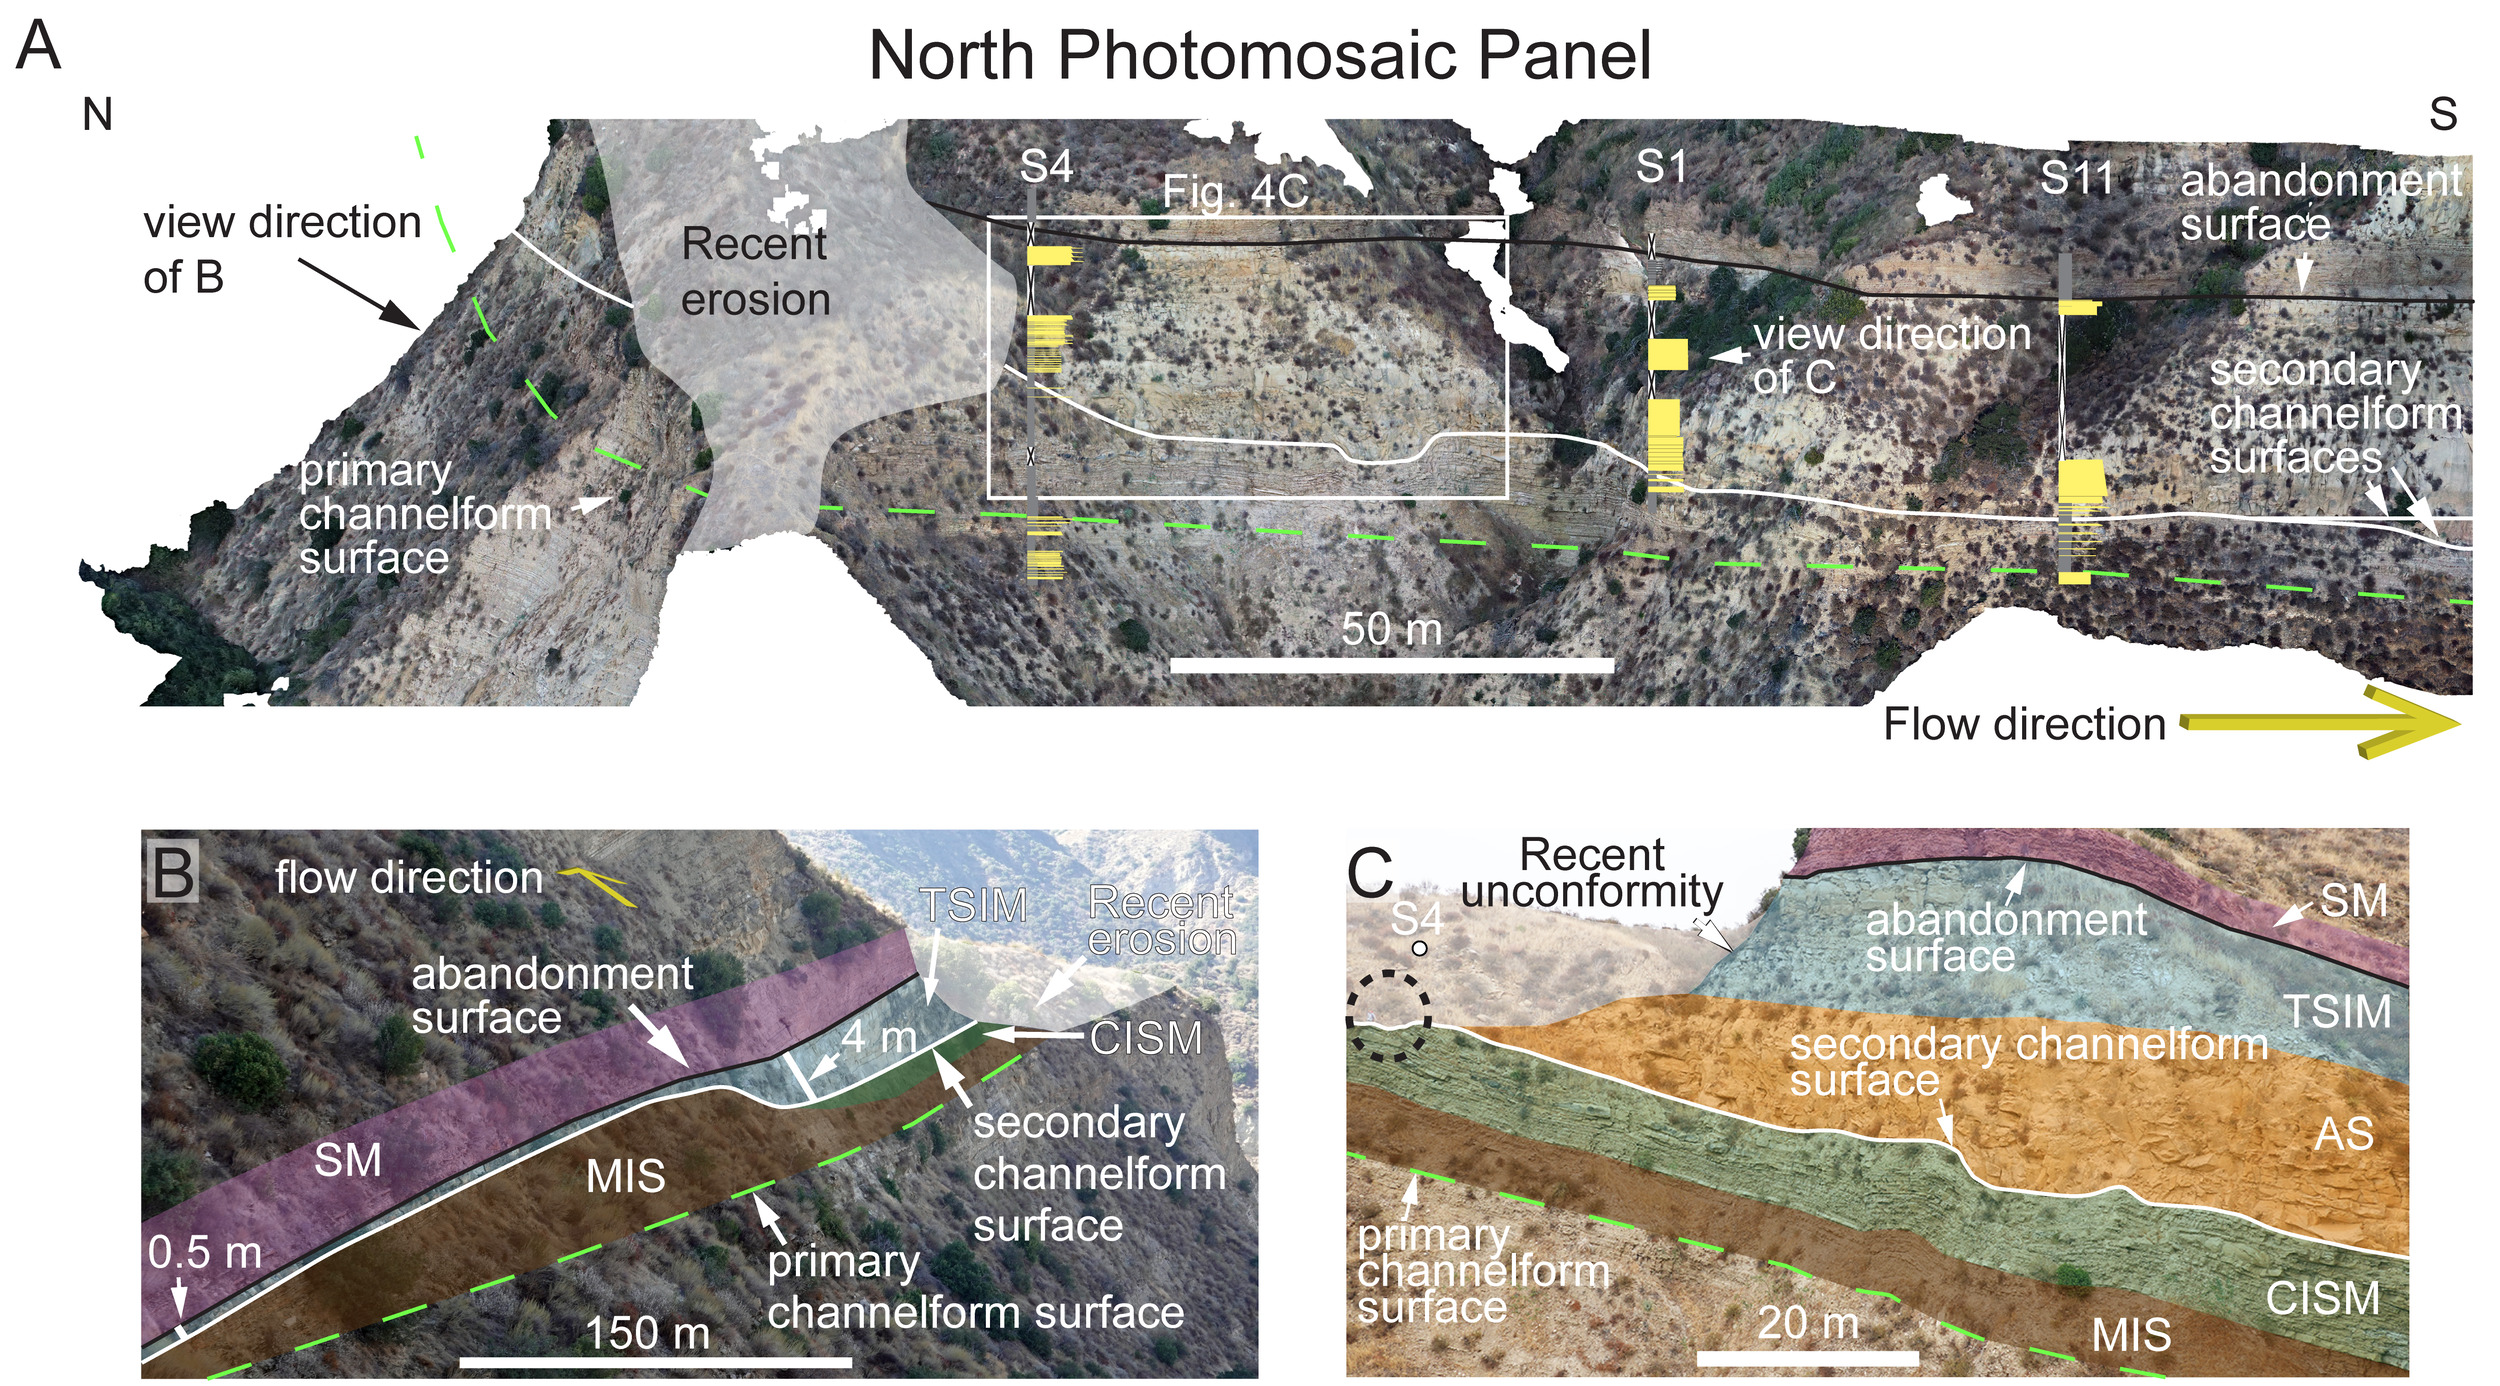
A DJI Phantom 4 Pro Version 2 UAV, equipped with a 20-megapixel camera, was used to take 691 photographs that were built into a three-dimensional digital outcrop model (e.g., Stright et al., 2017) using Agisoft Metashape software. This model was used to correlate surfaces in the inaccessible cliff faces and to create a high-resolution photomosaic (Fig. 3). This photomosaic was split into three panels (Figs. 4, 5 and 6) to show key facies and architectural features. The model does not include Section 9 and most of the outcrop north of Section 4 due to poor exposure.

RESULTS
Sedimentary Facies
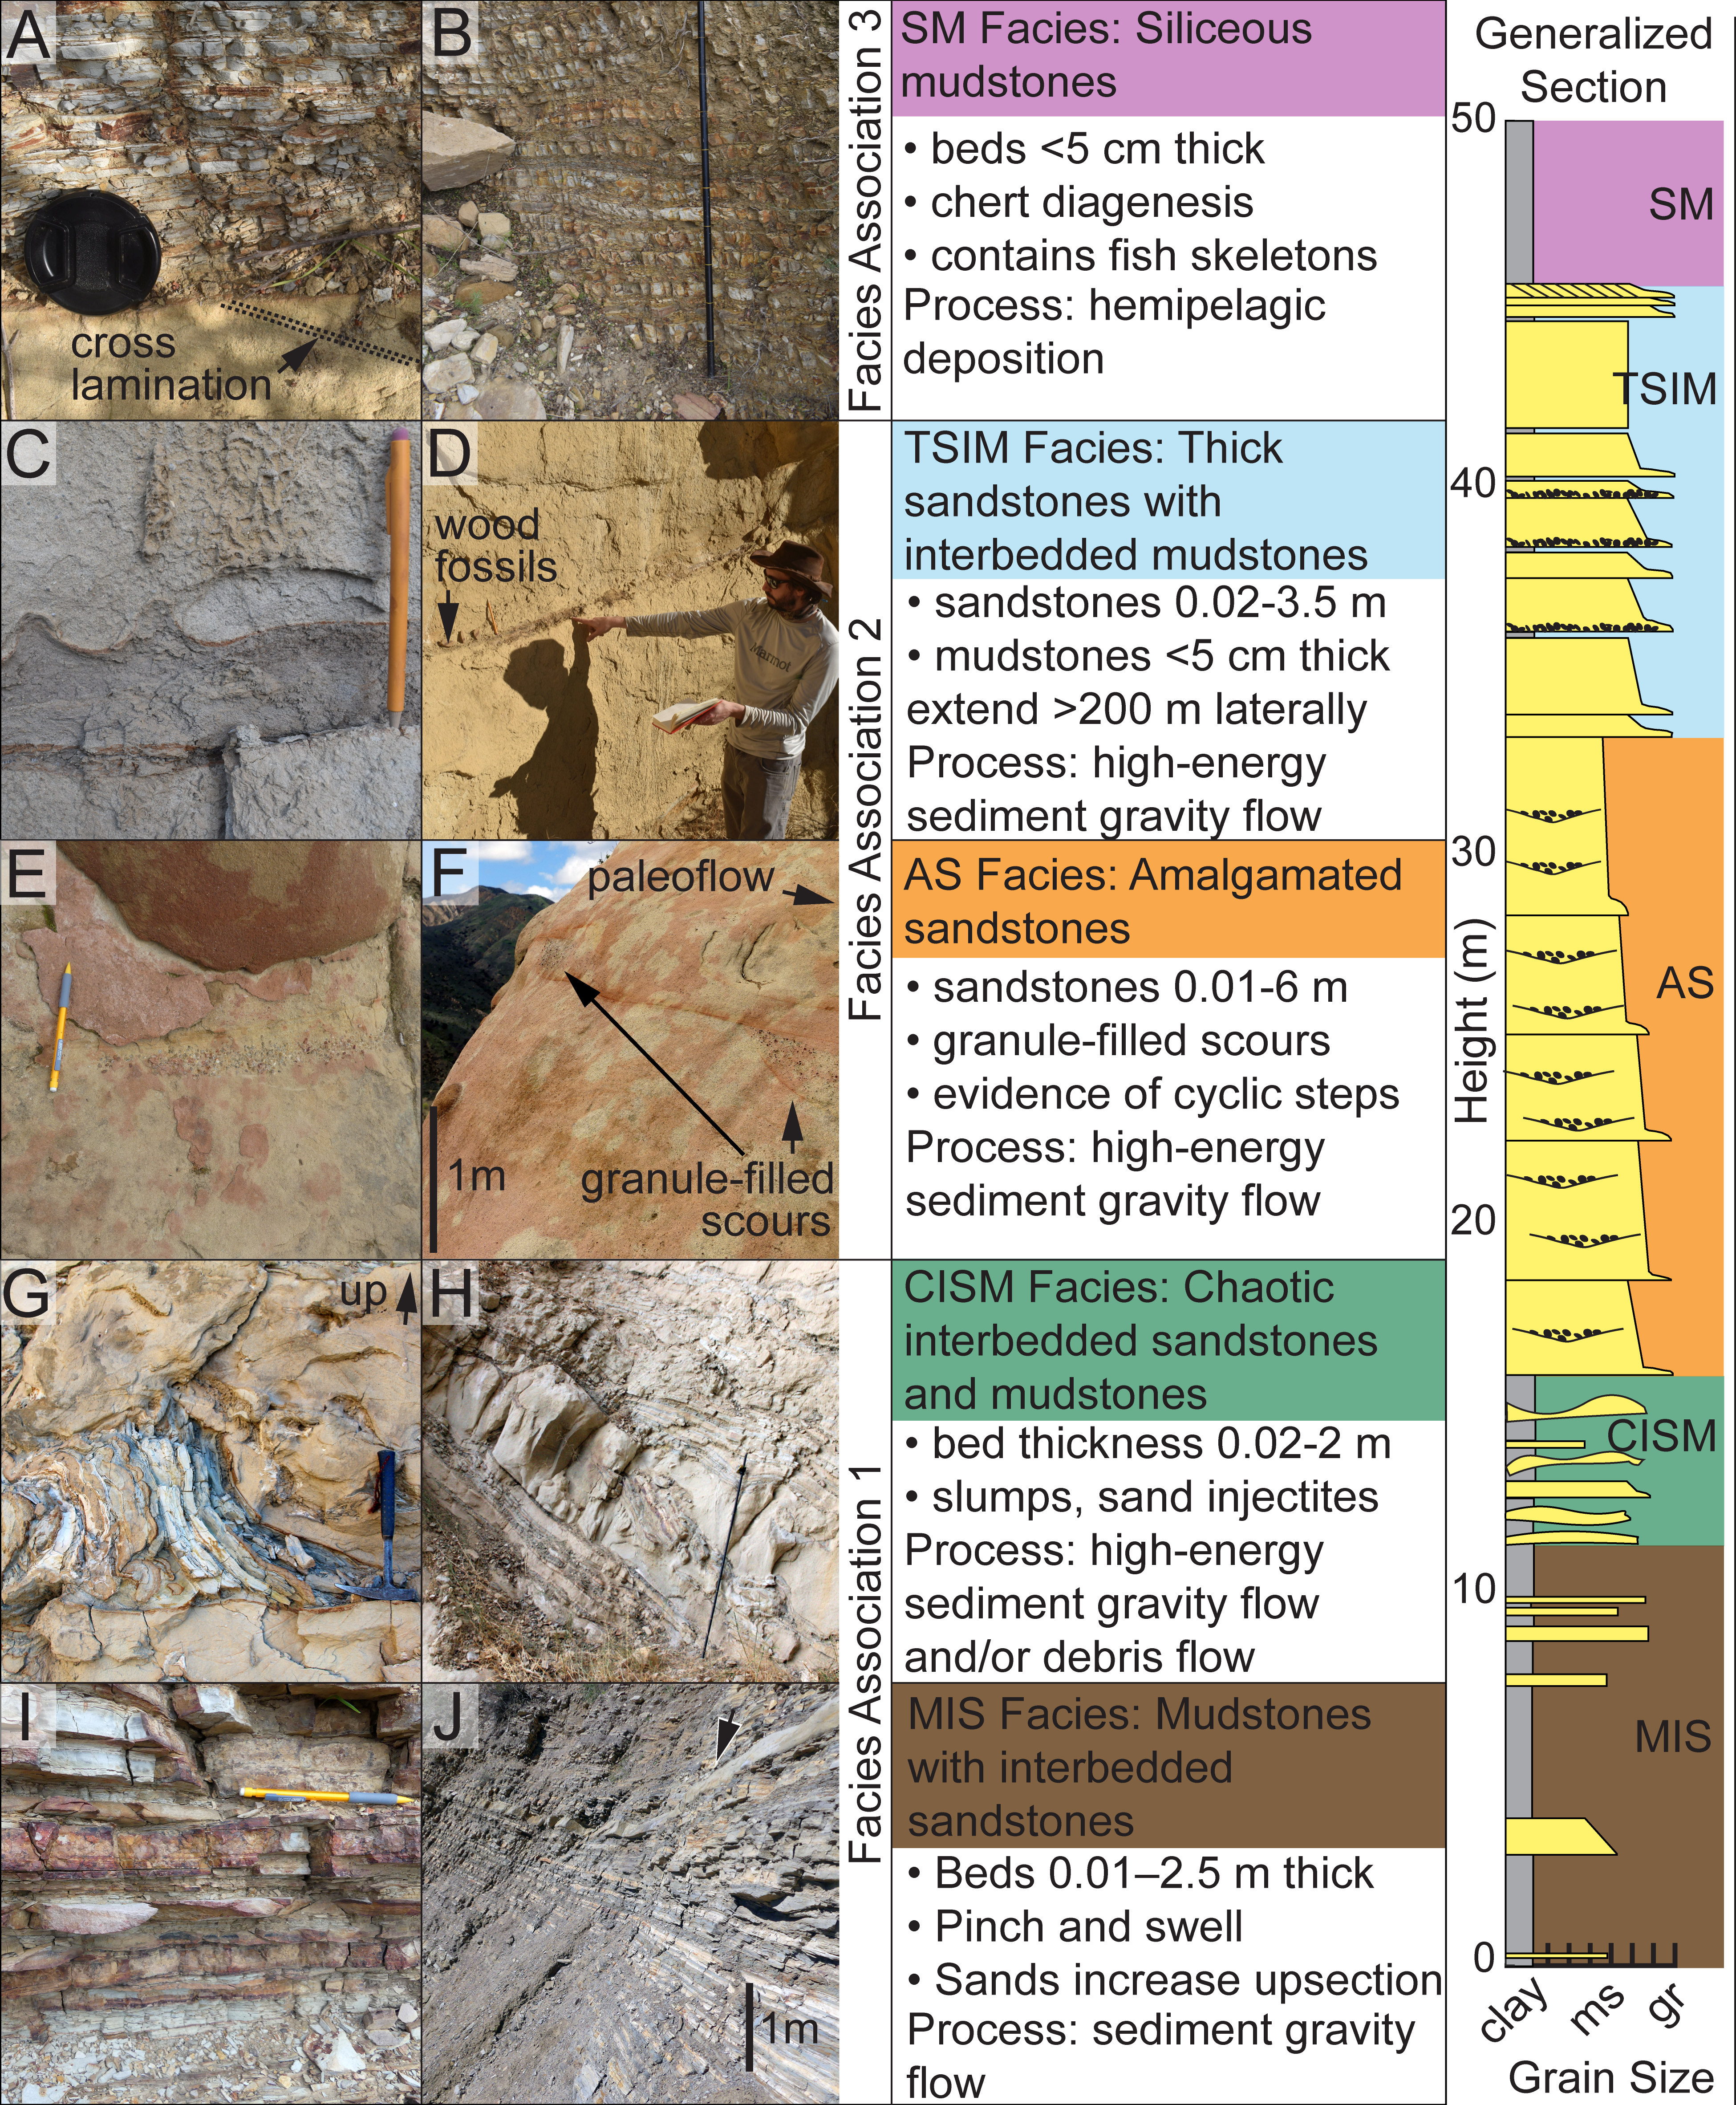
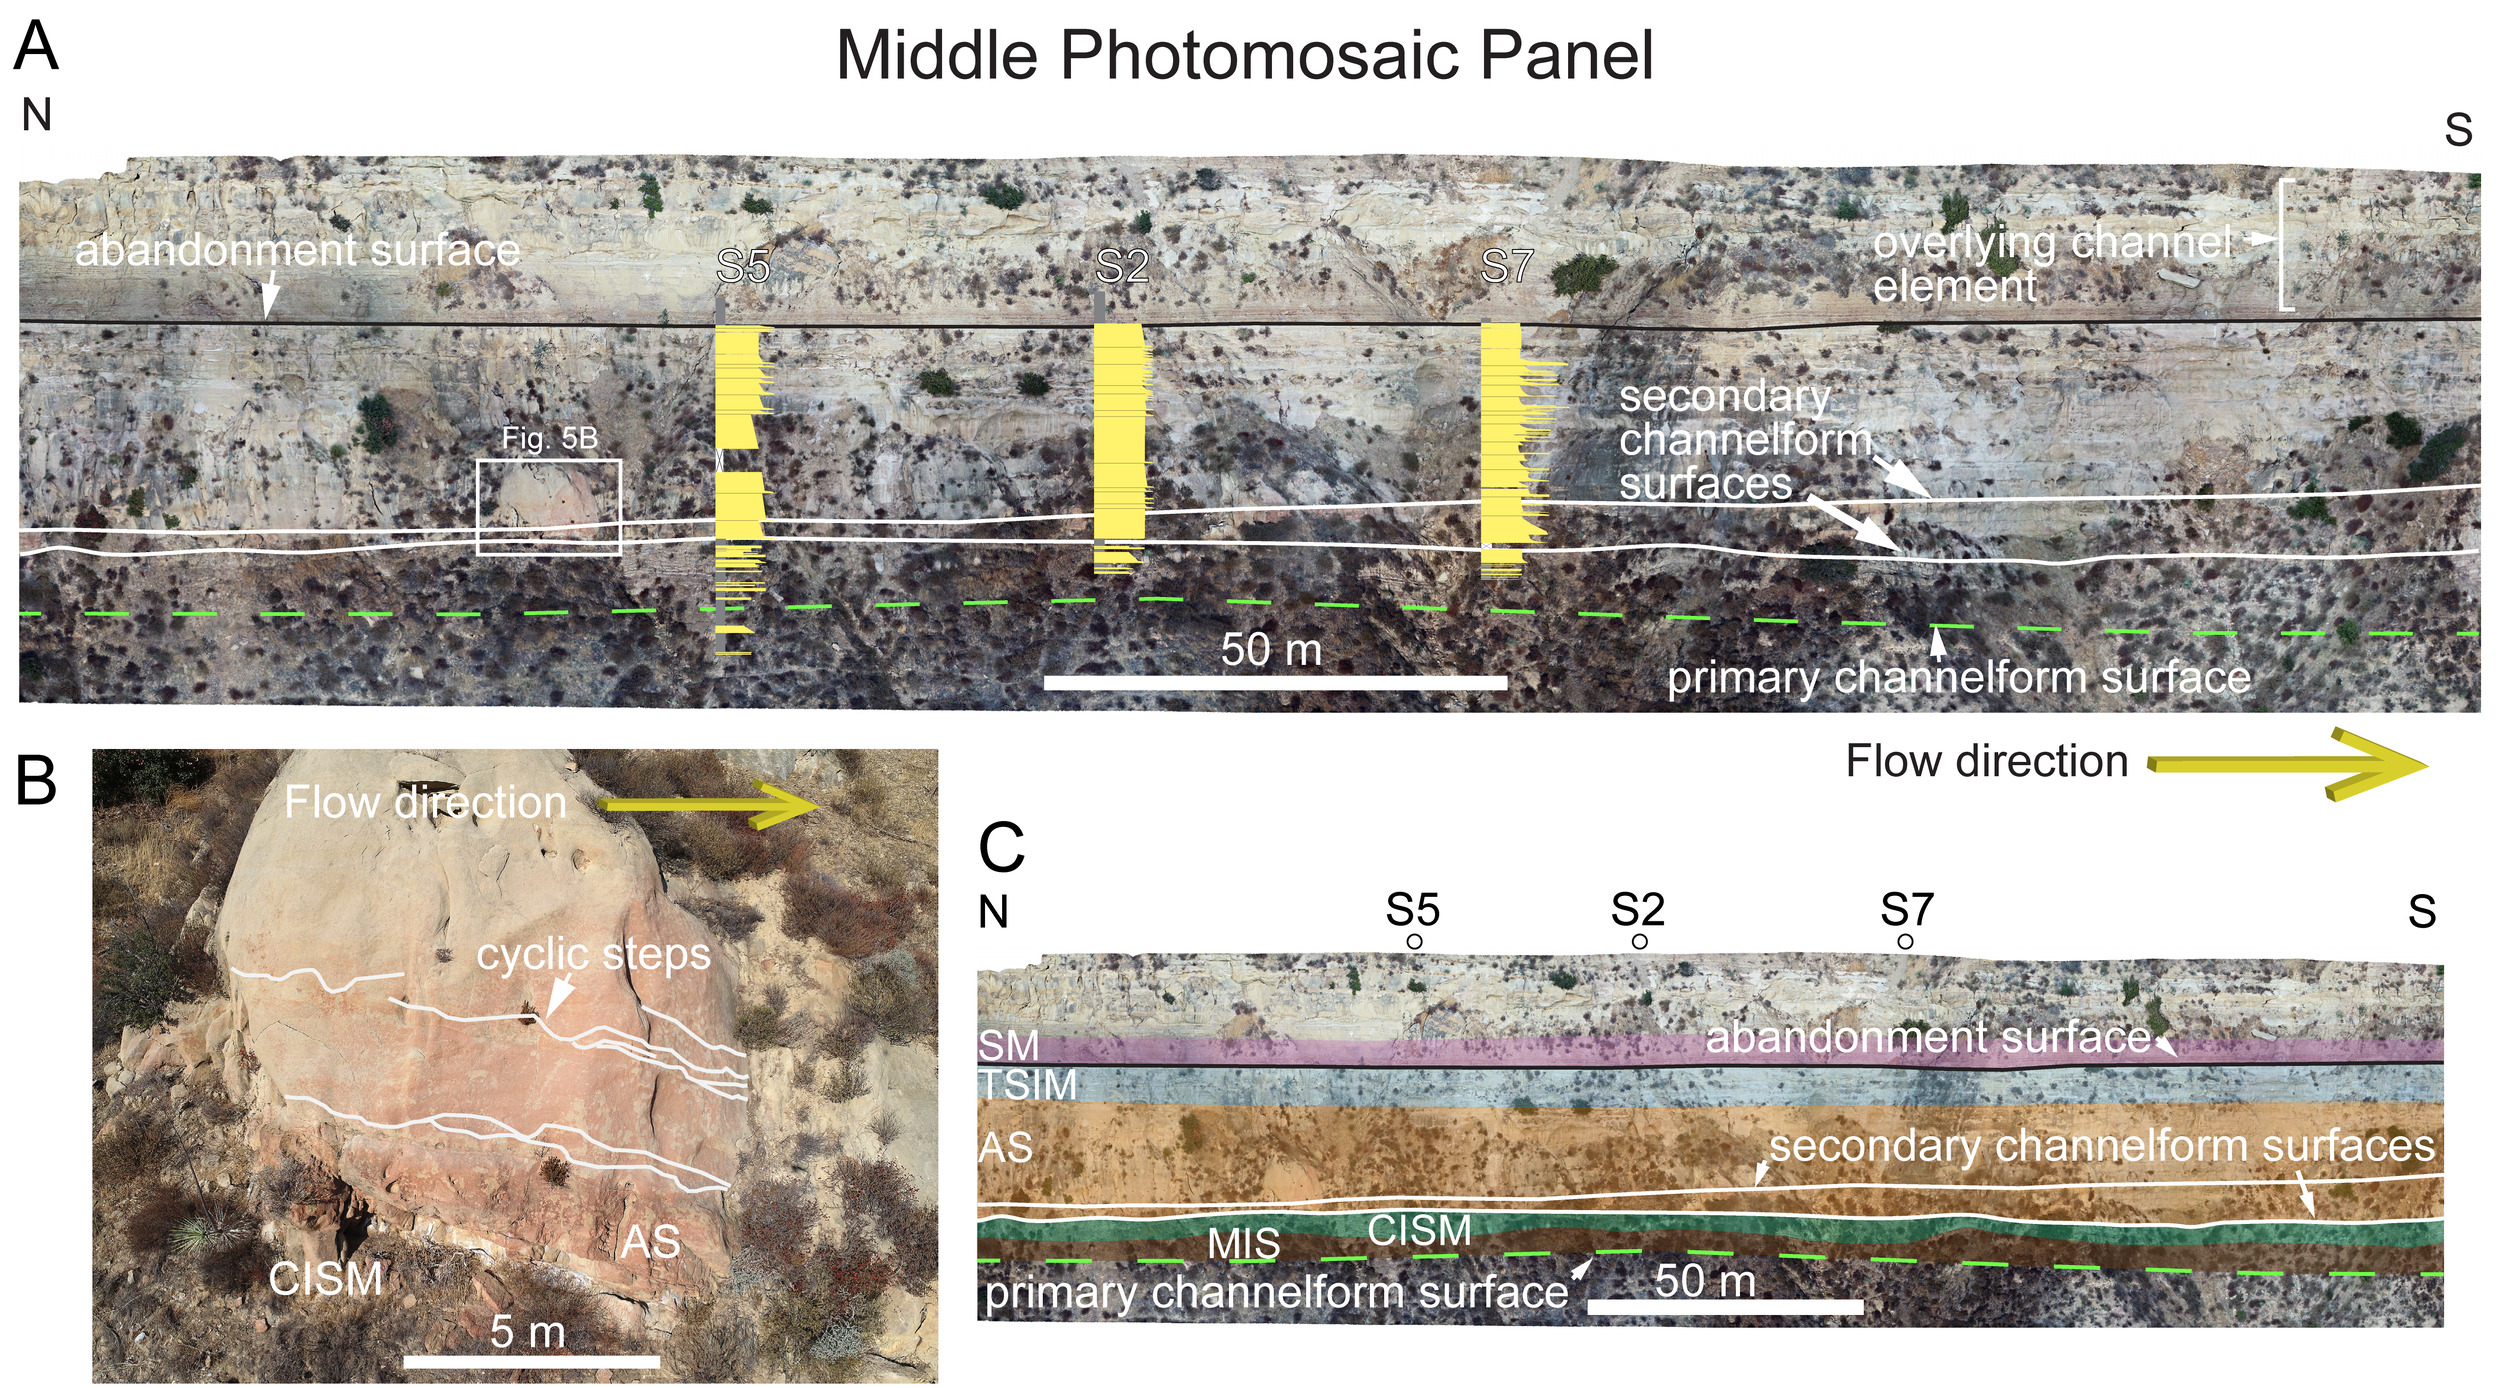
Five distinct sedimentary facies are present within the outcrop and descriptions of their thicknesses and sedimentary features are described from base to top within the idealized vertical stratigraphic succession (Fig. 2). Thin, normally graded mudstones with interbedded sandstones (MIS) that we interpret as turbidity current deposits (Lowe, 1982) are present at the base of each measured section. Chaotic interbedded sandstones and mudstones (CISM) contain contorted bedding and slump features that are commonly rotated perpendicular to bedding (Figs. 2G, 2H) and sand injectites up to 0.5 m tall. We interpret CISM as mass-transport deposits (sensu Talling et al., 2013). Thick, normally graded amalgamated sandstones (AS) contain granule-filled scours (Figs. 2E, 2F, 5B) that are interpreted as turbidity current deposits with cyclic step bedforms (Hage et al., 2018; Hughes Clarke, 2016; Kostic & Parker, 2006). Thick sandstones with interbedded mudstones (TSIM) sometimes contain 5-20 cm thick granule beds that extend 10-200 m laterally, which often give the outcrop appearance of AS; however, TSIM contains 0.02-0.04 m thick mudstones separating sandstone beds, with mudstone lateral continuity extending up to 200 m. Siliceous mudstones (SM) consists of <0.05 m thick chertified diatomite beds with abundant fish fossils (Figs. 2A, 2B), that are interpreted to be deposited by hemipelagic sedimentation (Behl & Garrison, 1994). Thin sandstones, siltstones and gray-brown mudstones are present 0.5 m above the base of SM.
Major Stratigraphic Surfaces
Four major stratigraphic surfaces can be traced across the study area and are identified by truncation and/or facies changes. The first surface is interpreted as a primary channelform surface (Hubbard et al., 2014) that forms the base of the channel element and is marked by a dashed green line (Figs. 3, 4, 5, 6). This surface lies within poorly exposed MIS and is estimated on Figure 3 based on the location of an underlying ~1 m sandstone bed. This sandstone bed is present in most of the sections and correlates to an underlying channel element best exposed in Section 3 (Fig. 3).
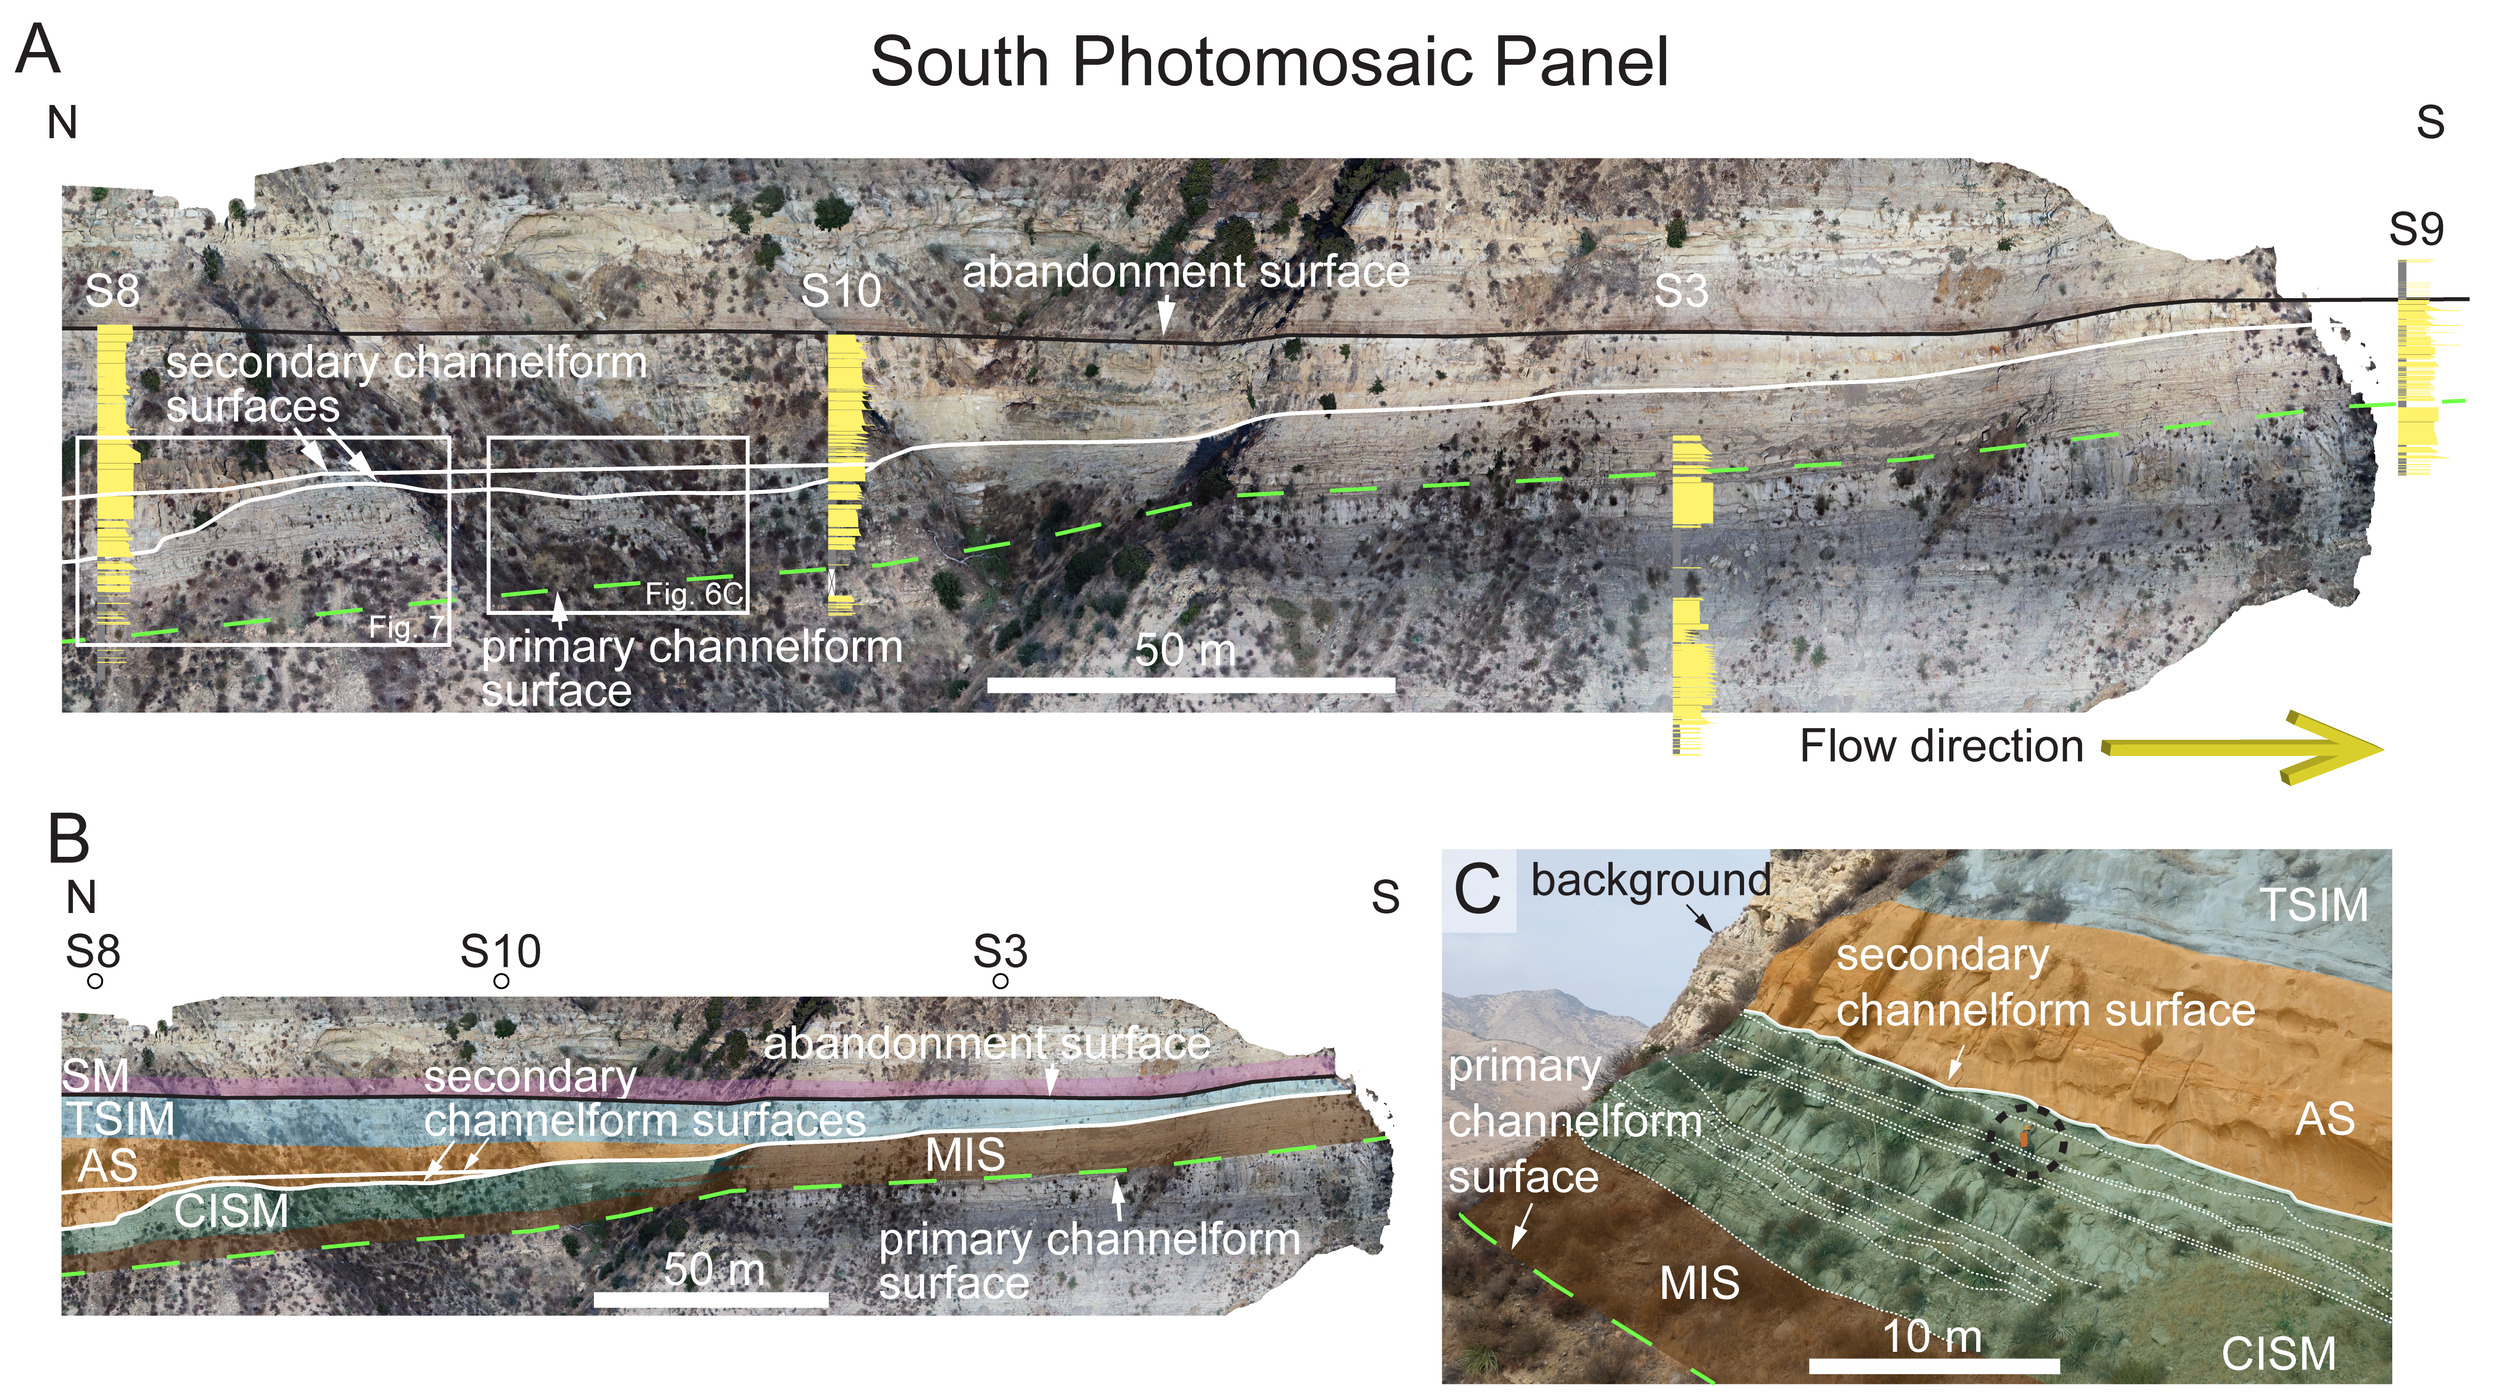
A second surface separates sandstone dominated facies (AS, TSIM) from underlying mudstone-dominated facies (CSIM, MIS) (Figs. 3A, 7). This surface has an overall concave-up shape and has local undulations throughout the outcrop and is interpreted as a secondary channelform surface (Hubbard et al., 2014, 2020). Above this surface and within the AS deposits is another interpreted secondary channelform surface that pinches out south of Section 11 and north of Section 10 (Fig. 3). Although the AS facies below and above this surface is similar, it is easily identifiable because of the high contrast created from the orange carbonate cemented beds (e.g., Fig. 2F) in the underlying deposits.
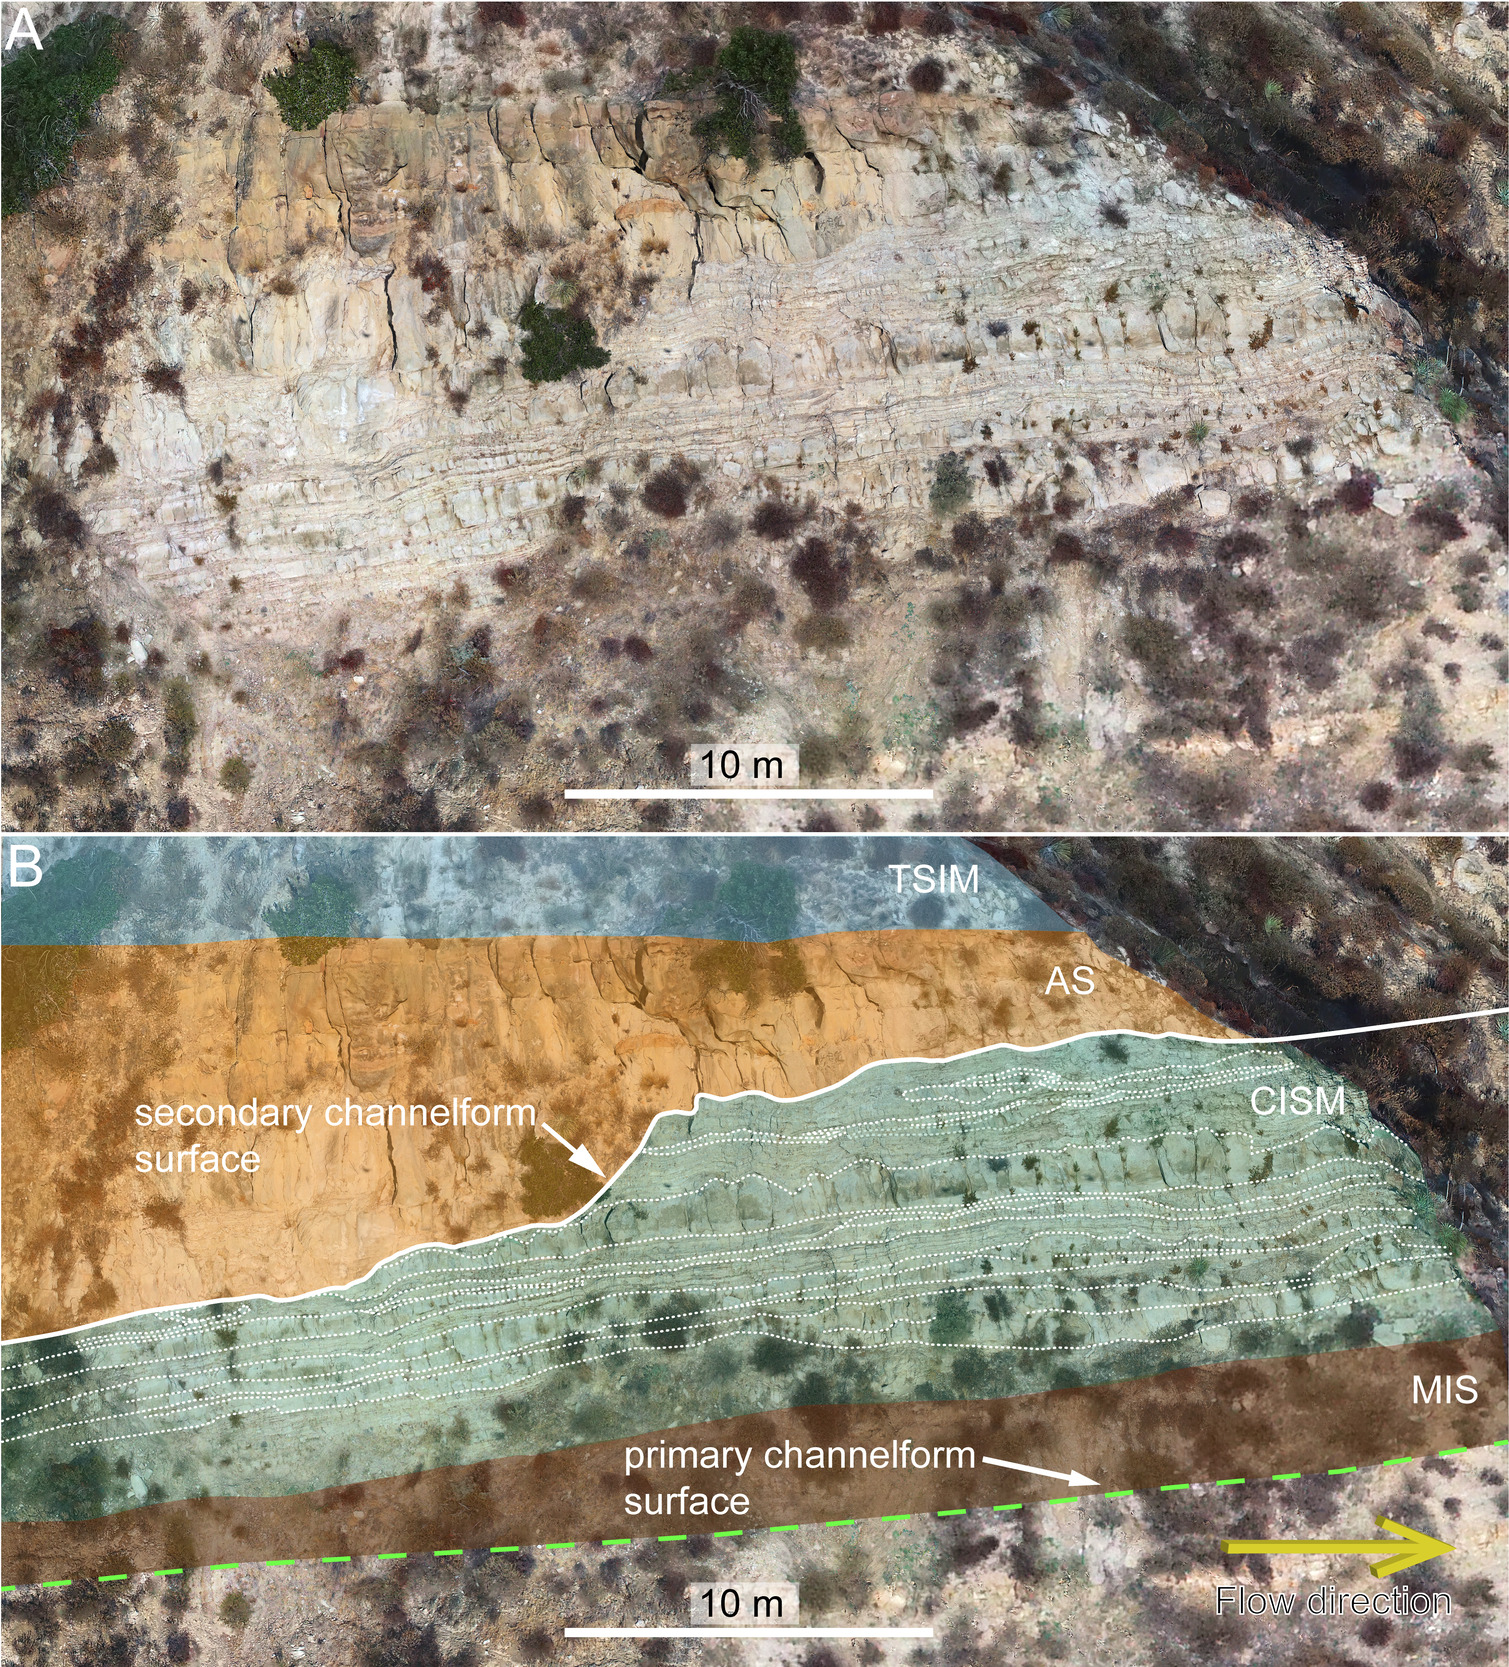
The fourth interpreted surface is the sharp contact between TSIM and SM, which is easily recognizable near the top of the channelform (Fig. 3). This surface is remarkably flat and any undulations in Figure 3 are caused by perspective. We interpret this surface as an abandonment surface due to the change from deposition by sediment gravity flows to hemipelagic deposition. The maximum vertical distance between the primary channelform surface and the abandonment surface is 41 m at Section 5 (Fig. 5), and the vertical distance between the stratigraphically lower of the two secondary channelform surfaces and the abandonment surface is 29 m.
Facies Associations and Facies Architecture
The five sedimentary facies are grouped into three Facies Associations (Fig. 2) based on similarities in depositional processes. Facies Association 1 (FA1) consists of MIS and CISM that were deposited directly above the primary channelform surface (Fig. 3). FA1 is thinnest near Sections 2, 5 and 7 in the center of the outcrop and thickens toward both pinchouts (Fig. 3B). Sandstone beds are thicker and more numerous in the upper part of FA1. We interpret that the interbedded mudstones and sandstones of FA1 were deposited by the waning tails of bypassing sediment gravity flows (Hubbard et al., 2014). CISM and MIS have similar lithology and often the chaotic beds of CISM appear to be MIS beds that were remobilized by soft-sediment deformation after deposition (Fig. 2).
Facies Association 2 (FA2) contains the thick, normally graded sandstones of AS and TSIM facies (Fig. 2). FA2 lies directly on a secondary channelform surface (Fig. 4) that has up to 10 meters of erosional relief into the underlying FA1 near Section 8 (Fig. 7). Evidence of cyclic step bedforms (Kostic & Parker, 2006; Hughes Clark et al., 2016; Hage et al., 2018) and laterally continuous granule beds are present throughout, but more common in the lower portion of FA2. We interpret that FA2 was deposited mainly in an axial position in the highest energy regime and that the scarcity of mud is evidence of sediment bypass and erosion. The sandstones of FA2 are 29 m thick in Section 5, which we interpret as the channel-element axis. FA2 thickens significantly toward the axis near Sections 1 and 10 and thins toward the margin where only the upper portion (i.e., TSIM) is present. FA1 thins significantly in these same locations. The chaotic beds of the upper portion of FA1 have the appearance of mass transport deposits that have only moved a short distance because although the mudstones are rotated, they are generally intact (Figs. 2G, 2H), similar to the ‘drape’ deposits described by Hubbard et al. (2014), with one key difference. Hubbard et al. (2014) describes the beds as well preserved in the channel-element margins, but poorly preserved in the axis and off-axis. However, the chaotic beds in the Modelo Formation (CISM) are better preserved in the axis and off-axis and are not present in the margins (Fig. 3A). This suggest that AS and CISM are genetically linked and were either deposited by the same sediment gravity flows or the beds of FA1 were slumped soon after deposition as loading from FA2 began.
Facies Association 3 (FA3) consists of siliceous (i.e., diatomite-rich) mudstones that are sometimes altered to chert (Fig. 2A), with only minor sandstones or siltstones (predominantly SM), which we interpret as evidence of hemipelagic deposition. Although diatomite intervals are present within every facies, SM is especially diatomite-rich, suggesting no significant terrigenous sediment input (Behl & Garrison, 1994). Thin, normally graded sandstone beds do reappear 0.5 m above the base of FA3 in Section 9 (Fig. 3B), but these sands are part of MIS facies of the overlying channel element (Fig. 3A). FA3 directly overlies the abandonment surface and is laterally continuous across the 1400 m of outcrop (Fig. 3).
Walker (1978) describes a model of progressive abandonment, where a diminishing amount of sediment would still be funneled into a channel, even after a partial avulsion occurs updip. We interpret the preservation of thin mudstones that can be traced up to 200 meters laterally in the upper part of FA2 to indicate waning energy conditions common near the top of channel-fill deposits (e.g., Jobe et al., 2010; McHargue et al., 2011). The contact between FA2 and FA3 is sharp, and cross-bedded sandstones are directly overlain by siliceous mudstones at Section 9 (Figs. 6A; 2A). We interpret this as an abandonment surface caused by a progressive updip avulsion. This preferred model of progressive abandonment (Walker, 1978) may explain the change from the highest energy regime in the channel-element axis, to a slight waning of energy conditions as a smaller portion of the flows are routed down the channel, followed by a sharp change to hemipelagic sedimentation upon complete abandonment.
Flow Direction and Channel Orientation
The paleocurrents are south-southwest oriented when restored to correct for structural dip (dip/dip direction = 25/100). This trend is generally consistent both vertically and laterally within the channel element (Fig. 1C); however, paleocurrent indicators were not found near Sections 2, 5 and 7. The vector mean is 188° and the vector magnitude is 10 for all paleocurrent readings and the mean is subparallel to the trend of the outcrop. When the paleocurrent data are split into two groups (i.e., north and south), the vector mean of the northern group of data (n=18) is 182°, while the vector mean of the southern data (n=15) is 205°. We interpret that the flow direction is to the south based on the presence of unidirectional current indicators, which agrees with the findings of Gordon and Pyles (2019). Therefore, the outcrop is exposed in a highly oblique view of the cross-section of the channel element, similar to exposures of the Tres Pasos Formation (Hubbard et al., 2014; Jackson et al., 2019). While the reconstruction of the channel element is more difficult when exposed in this orientation, it allows a more detailed dissection of the secondary channelform surfaces and facies architecture.
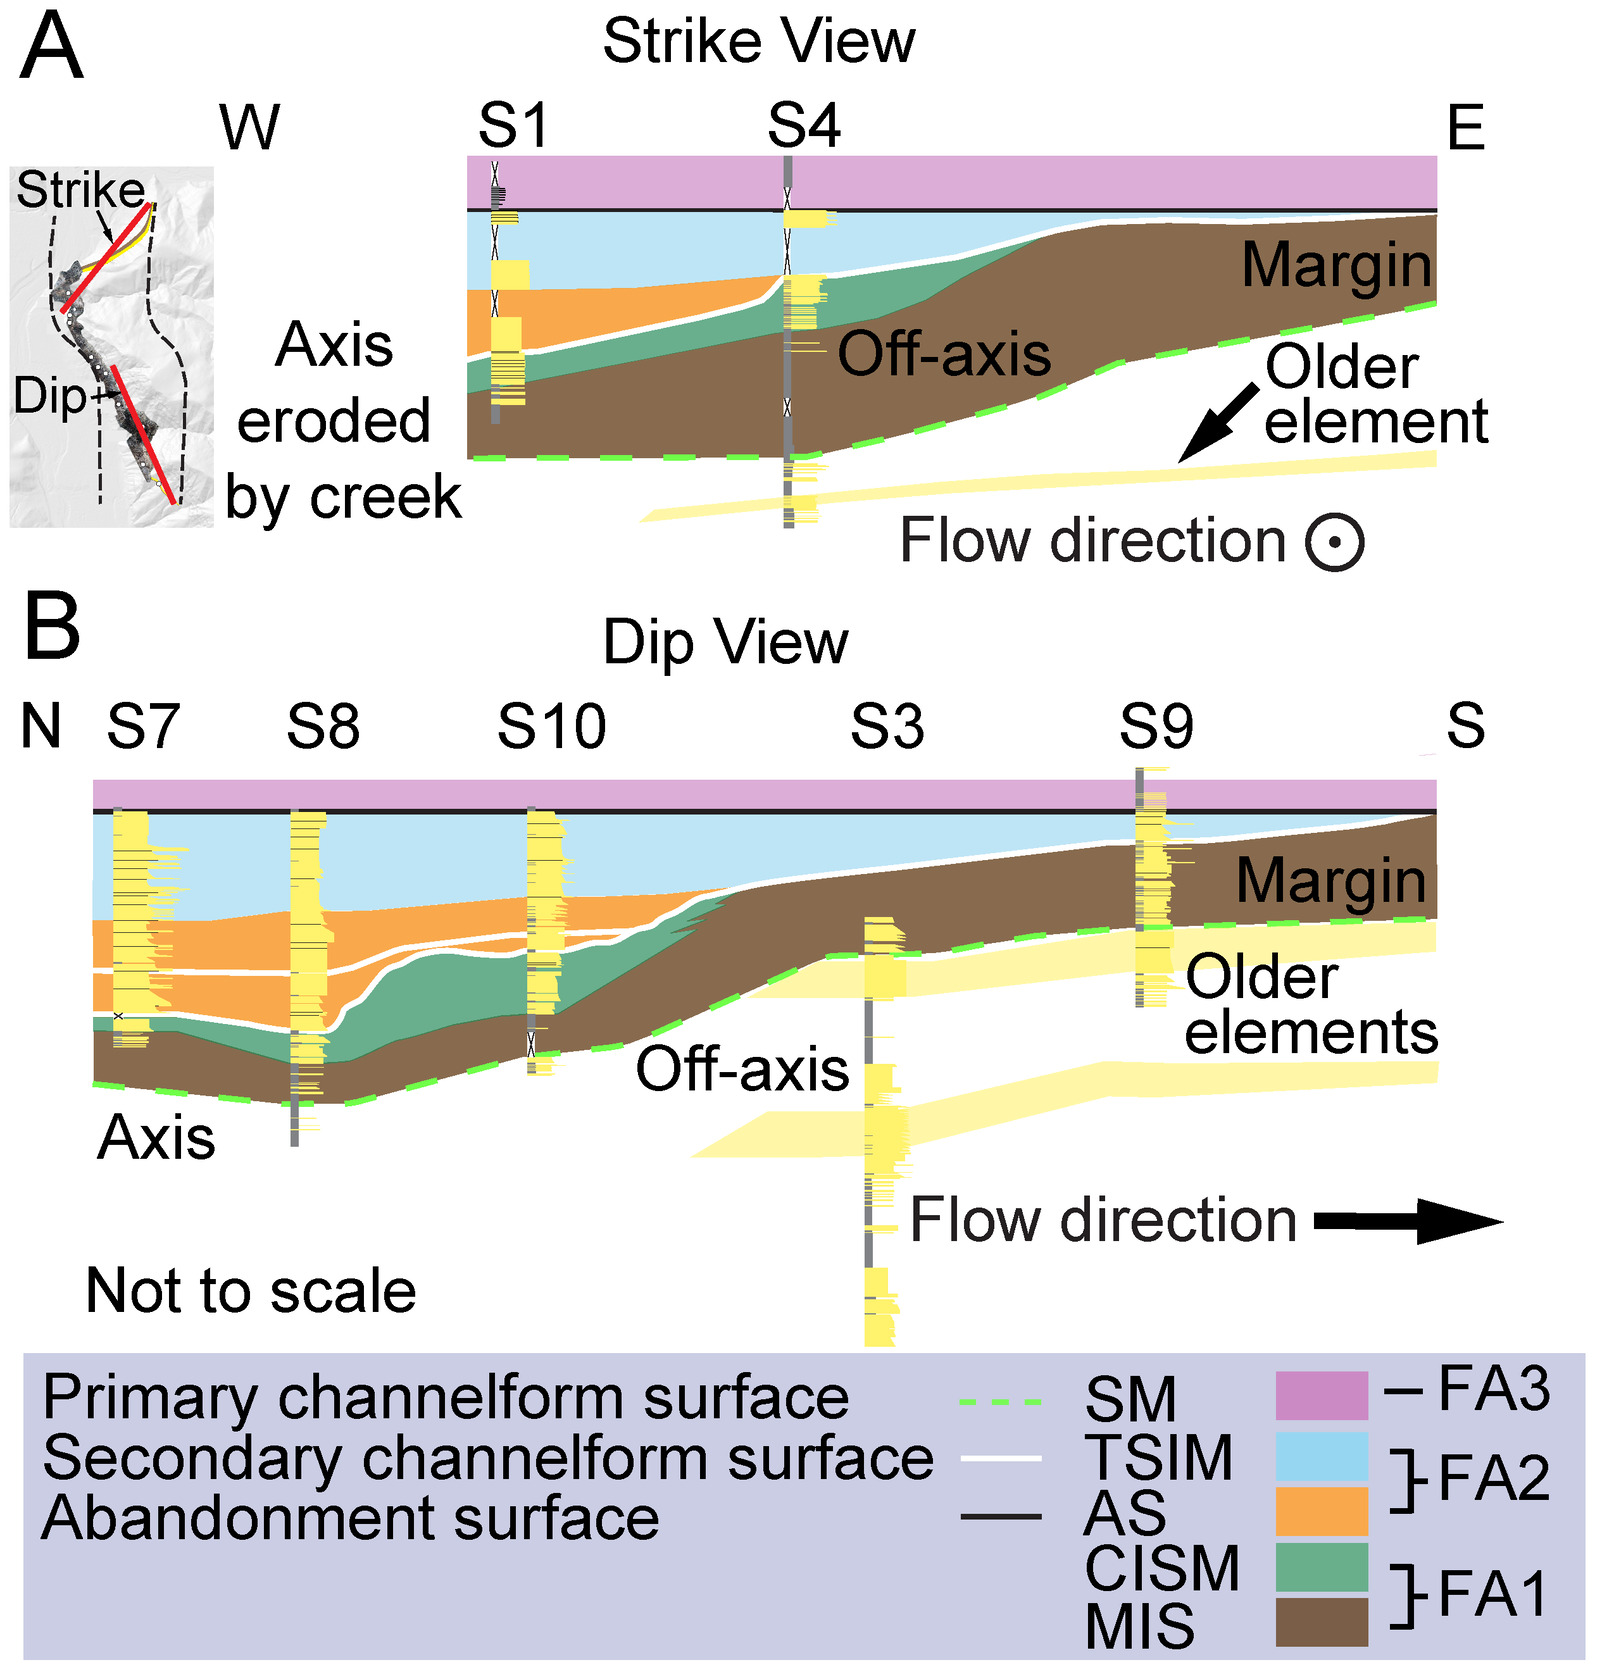
We interpret that the two pinchouts are different locations along the same margin of the channel element to the east (i.e., the left-hand edge when looking downslope) (Fig. 1C), with the northern location representing the up-dip margin (Fig. 8A) and the southern location representing the down-dip margin (Fig. 8B). FA2 changes thickness drastically over a distance of 100 m between Sections 8 and 10 and the secondary channelform surface on which FA2 was deposited has more erosional relief than the off-axis location near Section 4. We interpret that this sharp erosional contact (described in Fig. 7) is caused by a slight bend in the channel planform, which is corroborated by paleocurrent data. FA2 thins gradually toward the margin at both northern and southern exposures (Fig. 8). This thinning occurs over a distance of 150 m east of section 4 and the thinning occurs over a longer distance of 500 m toward Section 9 because of the obliquity of the outcrop with respect to the channel orientation (Fig. 1C).
DISCUSSION
Channel-Element Dimensions and Location on the Depositional Profile
Although there is >1400 m of outcrop exposing this channel element, the straight-line distance between the two sand pinchouts of the channel-element margin is only ~1100 m (Fig. 1C). Although a dip-oriented outcrop does not necessarily intersect the center line of the channel-element, we interpret that Section 5 is nearest the axis because FA2 is 29 m thick and thins away from Section 5. We interpret this change in the sand-shale ratio as evidence of sinuosity of the channel element. A straight channel trend line cannot be drawn through Section 5 that both honors the southern trend of the paleocurrent data and the thinning of FA2 (Fig. 1C). The interpretation of the axis location is displayed by a black dashed line (Fig. 1C). Another black line marks the interpretated eastern edge of the channel element that mimics the sinuosity of the axis interpretation and connects the two pinchouts. The solid line extending from Section 5 marks the shortest distance between the interpreted axis and margin. Therefore, we interpret that the minimum distance from axis to margin (i.e., half of channel-element width) is 275 m and full width is 550 m, which yields an aspect ratio of 19:1 (i.e., channel-element width divided by thickness) by using the 29 m thickness of sand in the axis. This calculation assumes that the channel was symmetrical, which is only common in straight reaches or near inflection points of sinuous channels (Reimchen et al., 2016; Shumaker et al., 2018). If the channel element is highly asymmetrical, or if Section 5 is significantly further to the west from the axis than our interpretation, it may be wider than 550 m, but is necessarily less than 1100 m, which is the distance between the two pinchouts in a dip orientation. However, the other margin (i.e., the right-hand side when looking downslope) has been completely eroded, so the full-width estimate is speculative. For example, the variability in facies architecture of symmetrical and asymmetrical channel elements discussed by McHargue et al. (2011) and Hubbard et al. (2014, see their Figure 1) demonstrates the uncertainty in our method for estimating channel width. The aspect ratio of 19:1 for this channel element is similar to that estimated in the Tres Pasos Formation (20:1), even though our width estimate of 550 meters is significantly wider than the 300 meter estimate (Macauley & Hubbard, 2013).
Cullis et al. (2019) provides a comprehensive dataset of channel element aspect ratios (i.e., channel-element width divided by thickness) and identifies a power law relationship to predict these dimensions. Using the 29 m thickness measured in our study and the power-law defined by Cullis et al. (2019), the element width is calculated to be 575 m, which is close to our map-based estimate of 550 m (Fig. 1). This corroborates our correlations of the two channel-margin exposures, the location of the channel axis at Section 5, and the channel position shown in Figure 3. Shumaker et al. (2018) reports a range of 10:1 to 100:1 for mean aspect ratios of submarine channels measured on the modern seafloor. The width and height of submarine channels might not be equivalent to interpretations of the width and thickness of submarine-channel elements based on their facies distribution. However, our measured aspect ratio of 19:1 is within the reported range of Shumaker et al. (2018), which further supports our outcrop-based estimates.
In order to consider the location of the channel element along the depositional profile, we compare the dimensional data to other published data. Pettinga et al. (2018) provides a comprehensive dataset of lobe-element aspect ratios (i.e., lobe element width divided by maximum lobe-element thickness) collected from global bathymetry data and reports a mean aspect ratio of 790:1, much higher than the 19:1 aspect ratio in our study area. Therefore, we interpret this as a channel-element and not a lobe. The thin mudstones separating sandstone beds in the TSIM facies are similar to some lobe-deposit facies (e.g., Morris et al., 2014).
Assigning an exact depositional environment within a general slope-to-basin-floor model is difficult, in part because the defining characteristics of each environment are often present in both, thus making them not diagnostic. Gordon and Pyles (2019) interpret the channelforms as incising submarine channels that become progressively more unconfined with passing time because they lie within the channel-lobe transition zone at the base of slope. However, these channel-elements contain many of the same characteristics of the slope channel-elements that Hubbard (2014) documents in the Tres Pasos Formation in Chile (e.g, similar facies characteristics and secondary channelform surfaces). Furthermore, the thickness of the sand-filled axis is 29 m, which is similar to the thickest channel elements in the Tres Pasos Formation and other outcropping channel elements (McHargue et al., 2011). Thus, we interpret the Lake Piru succession as a channel element on the slope of a steep-sided, tectonically influenced basin.
Facies Continuity in Dip Versus Strike View
The three-dimensionality of the outcrop provides a unique opportunity for comparing facies association continuity from axis to margin in both dip and strike view. The outcrop trend creates an ~90-degree angle in map view (Fig. 1B), displaying a dip-oriented cross section that is slightly oblique to flow direction from Section 4 to the southern margin. The outcrop is a strike oriented cross section between Fustero Point and the northern margin (Fig. 1C). The lateral facies association progression has a similar appearance in both dip and strike view (Fig. 8), and thickness changes occur over meters to hundreds of meters, similar to channel elements described in the Karoo Basin, South Africa (Bell et al., 2020). However, the pronounced thinning of FA2 from axis to margin occurs a lateral distance of 500 meters in the dip direction and only 150 meters in the strike direction. Locally, FA2 has up to 10 meters of thickness change over a horizontal distance of 100 meters in the dip direction within the off-axis and thins to the north and south (i.e., AS pinches out on the erosional secondary channelform surface and is therefore missing from Sections 4 and 9 (Fig. 3B). The contact between FA1 and FA2 appears more gradational in the dip direction between Sections 9 and 10 (Fig. 8B) than the same contact near Section 4 (Fig. 8A). However, erosion from the formation of the secondary channelform surface east of Section 4 appears to have removed a significant amount of FA1, and the element axis in the east-west direction has been eroded by Piru Creek (Fig. 8A), so this relationship is speculative.
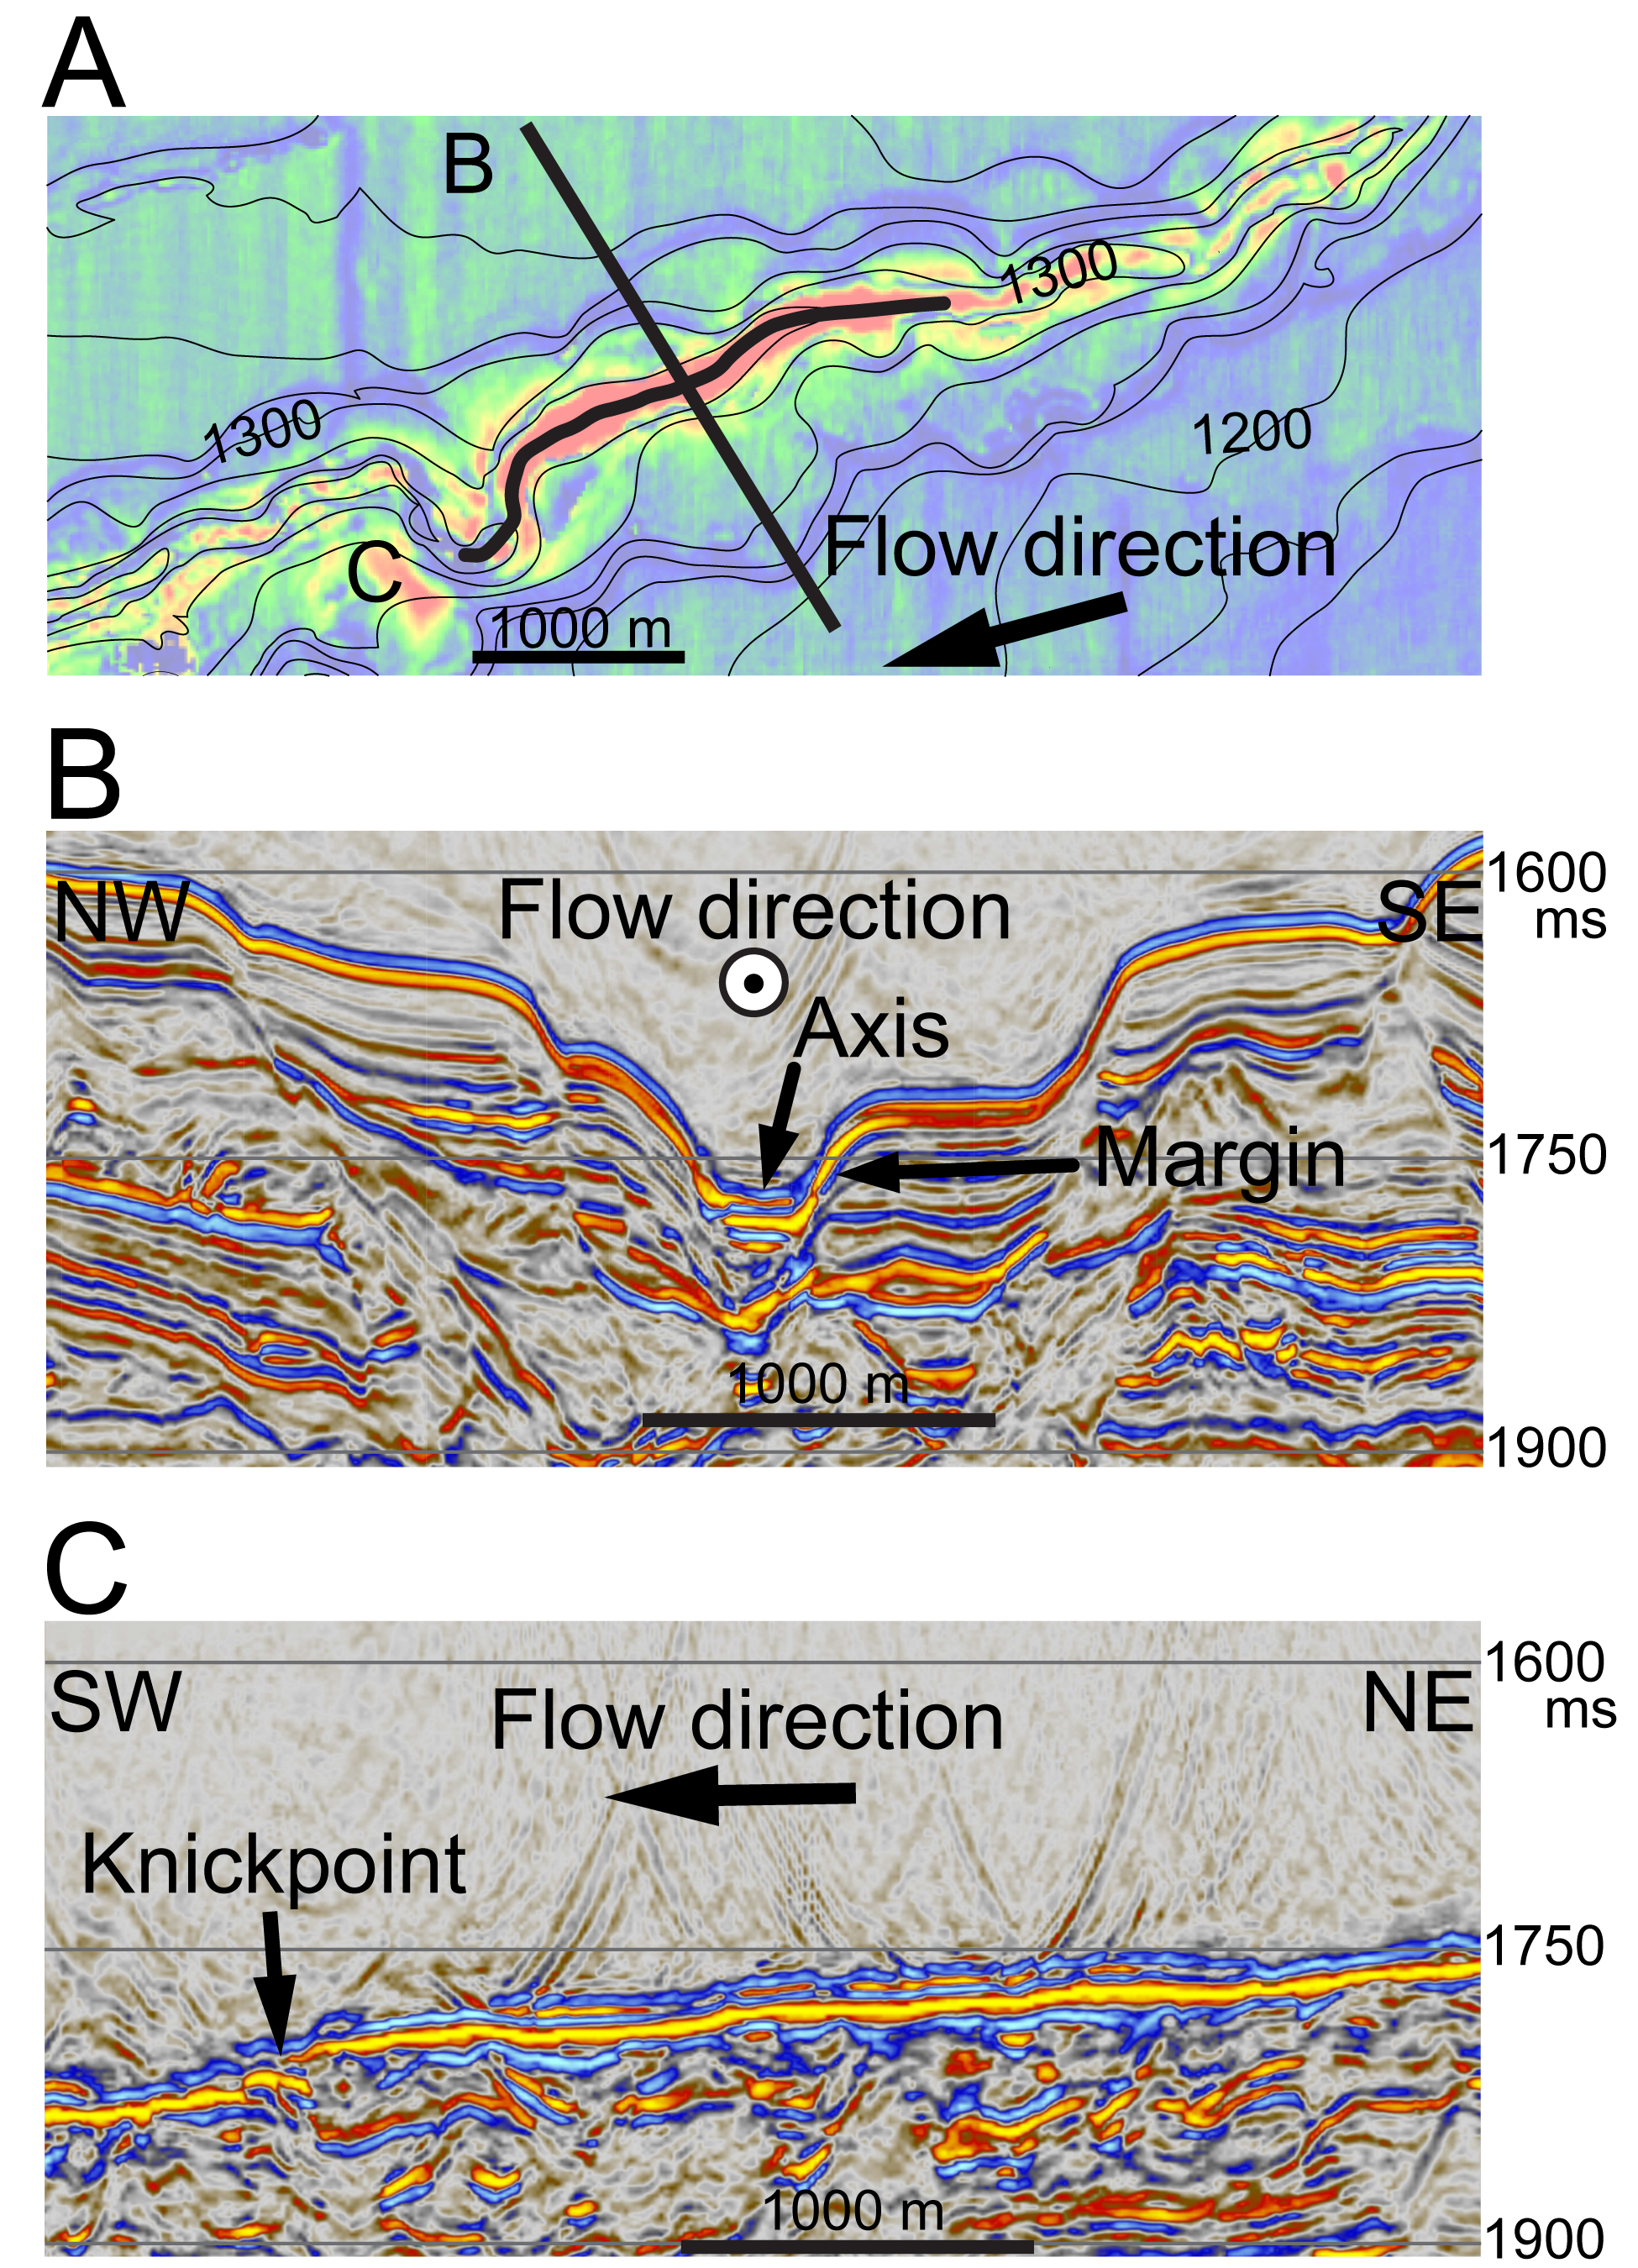
An important difference between the two cross-section orientations is that each facies has a wider lateral extent when viewed parallel to dip (Fig. 8) and this is especially true in FA2. This could potentially lead to overestimations of channel-element width or even misinterpretation as lobe deposits in settings where the orientation of the channel element is unknown. This contrast is illustrated using strike and dip views of a modern submarine channel on the Niger Delta slope (Fig. 9). When the cross-section view is oriented parallel to strike (i.e., perpendicular to flow direction), the channel displays a typical concave-up architecture, with an incised channel axis that rapidly changes facies across erosional surfaces to margins, internal levees, or terraces (Fig. 9B). When the cross section is dip oriented down the centerline of the channel (i.e., parallel to the flow direction), the architecture is simple, with axial deposits that are relatively flat-lying (Fig. 9C) even though there is >200 m of relief from the terraces to the channel floor in <200 m laterally toward both channel margins. Extreme examples like this one, where the cross-section view follows the sinuosity in the channel, are easily placed in proper geologic context when interpreting 3D seismic data. However, in outcrop settings like this study area, the trend of the outcrop with respect to the channel orientation is arbitrary and modified by modern erosion, presenting a more complicated view of the depositional architecture. For example, the axis sandstones in FA2 show strike-view complexity and rapid pinchout (Fig. 8A), but are well connected in the dip view (Fig. 8B). The unique, highly oblique exposure of this channel element demonstrates this dip-view connectivity (Fig. 8B), where sandstones in the axis truly are connected, as suggested by many reservoir models (e.g., Alpak et al., 2013) and demonstrated in some subsurface production data (Gonzalez-Carballo et al., 2006). However, MTDs within channel elements (e.g., Bernhardt et al., 2012; Ortiz-Karpf et al., 2015) and the vertical stacking of migrating elements can drastically impact the overall connectivity of a submarine channel complex (Jackson et al., 2019; Meirovitz et al., 2021).

Siliceous Mudstone Marking an Abandonment Surface
The presence of an abandonment surface in this channel element in between FA2 and FA3 is somewhat unique in the sedimentary record. Abandonment surfaces are often cryptic due to poor exposure or weathering of the mudstones. Amy and Talling (2006) used color and foraminifera content to distinguish between mudstones with a terrigenous source and those deposited from pelagic sedimentation in the Marnoso Arenacea Formation in Italy. The Ventura Basin is somewhat unique because of the rapid rates of hemipelagic deposition in Miocene basins along the western margin of North American (Pisciotto & Garrison, 1981). FA3 (i.e., SM) is a siliceous mudstone that was deposited by diatom tests falling out of suspension in the water column, which is an excellent environmental signal for pelagic sedimentation. Diatoms are present in all five facies, but the presence of chert in FA3 indicates high biogenic silica content with <10% terrigenous input (Behl & Garrison, 1994). Chert beds that are devoid of silt or sand are present directly above the contact between FA3 and FA2 (Figs. 2A, 2B), and we interpret this as a condensed interval marking the abandonment of the channel. This abandonment surface is used to constrain our channel-element thickness of 29 meters, which McHargue et al. (2011) hypothesizes to commonly be overestimated in outcrop.
CONCLUSIONS
This study documents the architecture of an outcropping submarine-channel element in the Miocene Modelo Formation at Lake Piru, California, USA. Five distinct facies are interpreted based on grain size, bed thickness and sedimentary structures which give a proxy for location within the axis, off-axis, and margin of the channel element. The siliceous mudstone present provides a unique marker for hemipelagic sedimentation and the presence of an abandonment surface. Paleocurrent data demonstrates that the flow direction of the channel was to the south. The calculated channel-element width is 550 m and the measured thickness is 29 m, which yields an aspect ratio of 19:1, in agreement with published ranges of channel-element dimensions. The 3-dimensionality of the outcrop allows both strike and dip oriented views of the architecture. The lateral facies progression from axis to margin is stretched out due to the highly oblique exposure, offering a rare opportunity to examine the dip-view connectivity of the channel element.
ACKNOWLEDGEMENTS
We thank the Chevron Center of Research Excellence at Colorado School of Mines (core.mines.edu) for funding and Jacob Covault, Evan Gross, Elisa Medri, Cahill Kelleghan, and Glenn Sharman for assistance in the field. We thank Morgan Sullivan, Fabien Laugier, Julian Clark, and Greg Gordon for guidance, Thomas Martin for manuscript editing and journal reviewers Eugene Szymanski and Rebecca Englert.