


INTRODUCTION
The goal of this paper is twofold. First, introduce a new quasi-automated workflow for well-log correlation that leverages the DTW algorithm with Barycenter Averaging (DBA). Secondly, to apply and test this workflow on a set of gamma-ray well logs from Gotland, Sweden, to improve the well-to-well correlations, thereby enabling a more detailed understanding of the subsurface framework of the Silurian succession beneath Gotland.
Geophysical well logs are an indispensable tool for geoscience, enabling the understanding of subsurface stratigraphy, lithological changes, and depositional facies. Closely spaced well logs enable higher-resolution reconstruction of sedimentary successions than is achievable with seismic reflection methods. Well-log-based correlations are often performed manually, a time-intensive and subjective process. This limitation highlights the need for automated workflows to efficiently analyse large datasets. Dynamic time warping (DTW) has emerged as a powerful algorithm for this purpose, offering efficient correlation across very different records, in complex stratigraphic settings (Baville et al., 2022; Fang et al., 1992; Grant et al., 2018; Hagen et al., 2020; Hagen & Creveling, 2024; Hagen & Harper, 2023; Hladil et al., 2010; Lallier et al., 2012, 2016; Lineman et al., 1987; Nieminski et al., 2024; Sylvester, 2023; Wheeler & Hale, 2014; Wichern et al., 2024; Wu et al., 2018; Zoraster et al., 2004)
By aligning time-equivalent strata across diverse logs, DTW can streamline well-log correlation and improve the resolution of subsurface interpretations. A major drawback of applying DTW to multiple records it that it might produce inconsistent correlations when extended across multiple wells, also known as the DTW open-loop problem (Sylvester, 2023). To address this, three general strategies have emerged for correlating stratigraphic records using DTW. The first approach propagates stratigraphic surfaces from a single reference curve (Hagen et al., 2020; Hagen & Creveling, 2024; Hagen & Harper, 2023; Hay et al., 2019; Wu et al., 2018). This method depends heavily on the accuracy of the reference curve, as any errors are propagated throughout the correlation network. The second strategy performs pairwise correlations between records, followed by a global realignment to ensure consistency (Nieminski et al., 2024; Sylvester, 2023; Wheeler & Hale, 2014). A drawback of this technique is that local mismatches in pairwise correlations can propagate errors during global realignment, leading to geologically unrealistic outcomes. This approach can also be computationally intensive, depending on the algorithm used. The third method iteratively refines correlations to converge on a consistent solution (Edwards et al., 2018; Lallier et al., 2016). Although this improves global consistency, it may converge on locally optimal but unrealistic results, particularly without stratigraphic constraints such as biozonations. Like the second approach, it can also be computationally demanding.
To overcome some of the limitations of existing DTW-based methods, we introduce a workflow that enhances traditional DTW techniques with two key innovations. This includes the use of relative stratigraphic depth (re)scaling before implementing the DTW algorithm, as well as the creation of an iterative reference curve generation using DTW with Barycenter Averaging (DBA). The iterative approach enables the reference curve to evolve dynamically based on an ensemble of input well logs, thereby reducing the bias that would arise if one relied on a single reference log.
The workflow is applied to a dataset of gamma-ray well logs from Gotland, Sweden. The island has long been recognised for its Silurian succession, including major biogeochemical events such as the Ireviken, Mulde, Linde, and Lau events (Biebesheimer et al., 2021; Calner, Jeppsson, et al., 2004; Calner, Munnecke, et al., 2004; Calner & Eriksson, 2006b; Eriksson & Calner, 2008; Erlström et al., 2022; Hartke et al., 2021; Jeppsson, 1996; Jeppsson & Calner, 2002; Vandenbroucke et al., 2013). Although outcrops and shallow cores from Gotland have yielded valuable insights into Silurian climate and biosphere dynamics, their stratigraphic thickness is often limited. Indeed, among the Silurian biogeochemical events, only the formations encompassing the Lau Event have been extensively mapped in the shallow subsurface using well logs (Eriksson & Calner, 2008; Erlström et al., 2022).
Two of the key wells in this study are the Altajme core/well and the St. Sutarve 2018 well, available in their original high-resolution digital form, unlike the rest of the dataset, which consists of digitised records. The Altajme core/well offers one of the highest-resolution δ13Ccarb records of the Silurian (Biebesheimer et al., 2021; Hartke et al., 2021; Stolfus et al., 2023), encompassing both the Ireviken and Mulde events. Integrating this core with gamma ray logs from Gotland enables a regional contextualization. The St. Sutarve-2018 well is central in the geological framework of the subsurface of Southern Gotland (Erlström et al., 2022). Placing this well within a broader regional context will enable a more refined understanding of the geological evolution of Gotland. The implemented workflow will improve stratigraphic correlations across a transect of ~60 kilometres, linking surface and subsurface data, but also establishes a new avenue for the application of Dynamic Time Warping in stratigraphic studies.
GEOLOGICAL SETTING
The Silurian succession on Gotland was deposited in the Baltic Basin, an intracratonic basin on the palaeocontinent Baltica. During the Silurian, Gotland was located on the northwest flank of the basin, where the water depth increased to the southeast (Baarli et al., 2003). The thickness of the succession increased from circa 250 m in the north to circa 500 m in the south of Gotland, as the basin has a gentle dip of 0.2-0.4 degrees to the southeast. Baltica was located ~10–20° south of the equator during the Silurian, and deposition occurred in a tropical to subtropical setting. The succession is typified by approximately 100 carbonate platforms that prograded from the northeast to southwest during the Silurian (Bjerkéus & Eriksson, 2001; Flodén et al., 2001; Tuuling & Flodén, 2013). These platforms fingers out into in deeper marine depositional settings to the S-SE. The resulting stratigraphy consists of alternating shale or marl and reefal limestone, forming a south-eastward-prograding sequence (Calner, Jeppsson, et al., 2004; Calner, Munnecke, et al., 2004; Calner, 2005; Calner & Eriksson, 2006b; Jeppsson, 1996; Jeppsson et al., 2006). Due to erosion and the regional dip, progressively younger strata are exposed toward the southeast.
Within individual units, shallow-water facies such as reefal carbonates dominate the northwest, transitioning to deeper-water shales and marls in the southeast. A long-term shallowing trend during the Silurian led to the gradual south-eastward progradation of reefal facies, with shallow reef deposits reaching southeastern Gotland by the Ludfordian (Bjerkéus & Eriksson, 2001; Flodén et al., 2001; Tuuling & Flodén, 2009).
The Silurian strata of Gotland, Sweden, provide an exceptional record of biotic, geochemical, and lithological changes during the Silurian, including the Ireviken, the Mulde, Linde and Lau events (Aldridge et al., 1993; Biebesheimer et al., 2021; Bowman et al., 2019; Calner, Jeppsson, et al., 2004; Calner, Munnecke, et al., 2004; Calner & Eriksson, 2006a; Claussen, 2024; Hartke et al., 2021; Jeppsson et al., 1995, 2006; Jeppsson & Aldridge, 2000; Stolfus et al., 2023; Vandenbroucke et al., 2013; Younes et al., 2017). These events represent major perturbations to the Earth’s climate system, characterised by extinction episodes, shifts in carbon isotope signatures, and substantial changes in marine ecosystems and depositional environments.
The Ireviken Event is the oldest Silurian event recorded on Gotland and spans the Llandovery-Wenlock boundary interval, and is represented in the Lower Visby to Hangvar. The Ireviken Event is associated with a major extinction event and a positive δ13C excursion (Cramer et al., 2010; Jeppsson, 1987; Melchin et al., 2012, 2020; Rose et al., 2019). The Mulde Event, occurring during the Homerian Stage (~428 Ma), is preserved in the Fröjel to Klinteberg formations and linked to a minor extinction and a positive δ13C excursion (Calner et al., 2006; Calner & Jeppsson, 2003; Jeppsson et al., 2006; Samtleben et al., 2000). The Linde Event took place in the early Ludfordian and is associated with a minor extinction and a tiny δ13C excursion (Claussen, 2024; Jeppsson & Aldridge, 2000). The Lau Event took place in the late Ludfordian and is associated with a major extinction event and one of the largest δ13C excursions of the entire Phanerozoic (Calner, 2008; Calner & Eriksson, 2006b; Eriksson & Calner, 2008; Frýda et al., 2021; Younes et al., 2017). The Lau Event is recorded in the Botvide member of the När Formation and the Eke and Burgsvik formations (Calner, 2005; Eriksson & Calner, 2008; Erlström et al., 2022; Jeppsson, 1998).

MATERIALS AND METHODS
This study utilises a total of thirty-eight gamma-ray well logs from Gotland (see Figure 1 and SI.1), several of which have been published (Erlström et al., 2022; Erlström & Sopher, 2019; Levendal et al., 2019; Sopher et al., 2016). The Altajme and St. Sutarve 2018 wells are available in original high-resolution digital form, while the rest belong to the legacy Oljeprospektering AB (OPAB) dataset managed by the Swedish Geological Survey (SGU), originally acquired as analogue paper logs by Oljeprospektering AB between 1960 and 1990; SGU has since digitised a subset of these. Missing or incomplete logs were manually digitised for this study using the Log-Evolve™ software (see SI.1).
The wells sampled in this study represent more distal shelfal successions rather than shallow reefal carbonates (see Figure 1 and geological setting), making them especially suitable for Dynamic Time Warping (DTW) since they offer greater continuity and completeness. To compare surface geology with subsurface gamma ray records, surface maps from Manten (1971) and Calner et al. (2004) were digitised in QGIS and integrated with literature data.
Gamma-ray logs, the primary data type used, reflect natural radiation from Potassium-40, Uranium-238, and Thorium-232 in surrounding rocks (Ellis & Singer, 2007). Since spectral gamma data are unavailable for Gotland, interpretations focus on relative changes in log motifs. The logs have a vertical resolution of about 0.15 to 0.3 meters (Ellis & Singer, 2007). The limited resolution, combined with the inclusion of legacy data, restricts the ability to correlate on a bed-by-bed basis. As such, we will focus on general patterns, inflexion points, and prominent metre-scale peaks and troughs.
One aim of this study is to present a quasi-automated workflow for well-log correlation using the Dynamic Time Warping (DTW) algorithm combined with Barycenter Averaging (DBA). Rather than redeveloping existing methods, this study integrates off-the-shelf R functions into a practical workflow for well-log correlation. The use of established and optimised R packages ensures computational efficiency and reproducibility. In particular, the dtwclust package (Sardá-Espinosa, 2019) provides a robust implementation of the DBA algorithm, which is multi-threaded by default and allows rapid computation of the regional reference curve, typically within minutes. Intermediate data processing steps, such as Taner filtering and LOWESS regression, were performed using functions from the astrochron package (Meyers, 2019). For readers seeking a detailed technical background on the underlying algorithms, we refer to the comprehensive discussions in Sardá-Espinosa (2019) and Meyers (2019). To promote transparency and reproducibility, the full R code implementation is provided in Supplementary Information S3, with an accompanying R Quarto and HTML versions available at https://github.com/stratigraphy/DTW-Gotland, which include step-by-step explanations of each stage of the workflow.
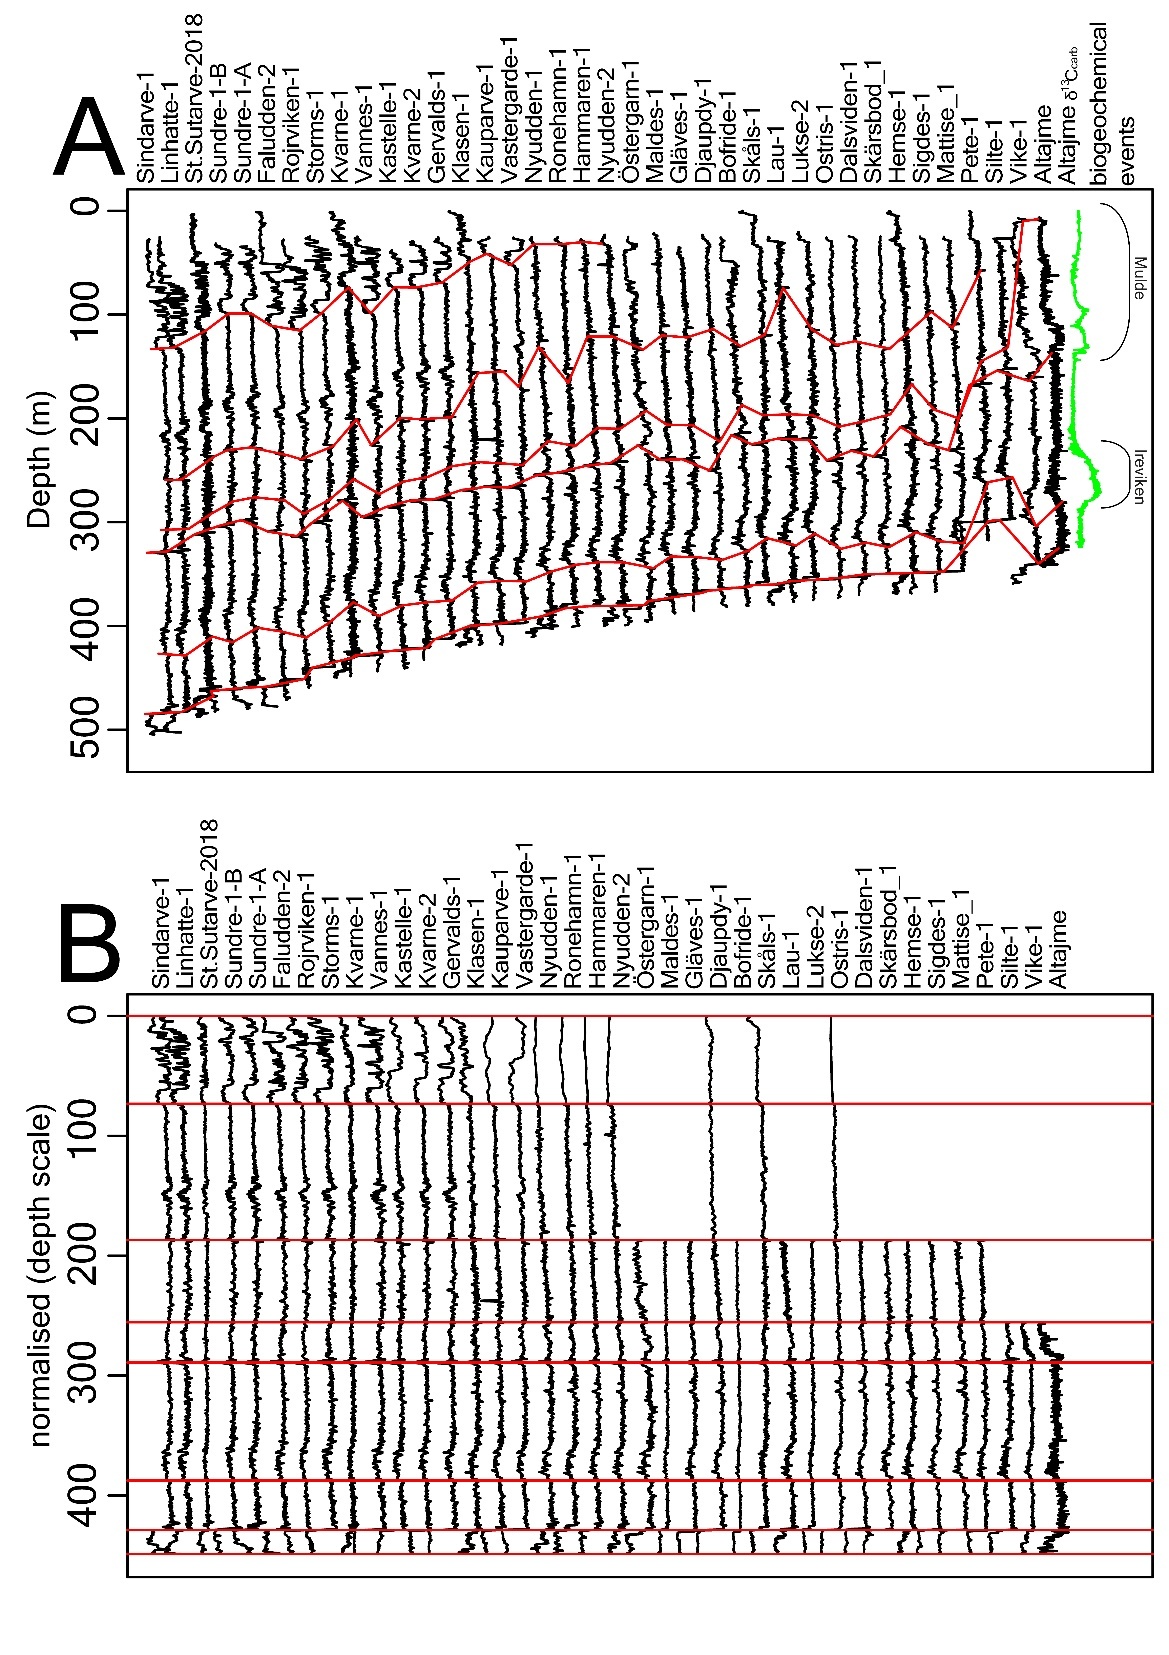
Before the analysis, all gamma-ray logs were normalised to a scale of -1 to 1 to allow for a consistent cross-well comparison and to remove any differences in scaling in values due to the use of different gamma-ray well-logging tools. The well-logs were pre-stretched to a common depth scale, a technique often referred to as placing data in “relative geological time” (Sylvester, 2023). DTW-based studies typically apply this concept to close loops and correct errors after DTW correlations have been conducted (De Bruin et al., 2007; Lomask et al., 2009; Qayyum et al., 2015; Sylvester, 2023; Wu et al., 2022).
Pre-stretching offers a clear advantage, as DTW compares patterns within time-series data and, without accounting for thickness variations, stratigraphically equivalent features may misalign. The pre-stretching was guided by six manually selected tie points corresponding to key stratigraphic features (see Figure 2). The pre-stretching using the tie points acts as a (soft) constraint on the stratigraphic framework, since subsequent DTW runs within the DBA modelling run can still redraw correlation paths based on signal similarity. In this way, geological expertise is integrated without overriding the algorithm’s capacity for objective, data-driven alignment. The approach used is particularly valuable in intervals where correlation confidence is variable rather than absolute. The well logs were pre-stretched to the average observed thickness between the two tie points in the set of wells. Logs were stretched to the average thickness observed between tie points. The Altajme and Vike-1 wells were excluded from the average thickness calculation because their upper intervals are affected by a prograding reefal system during the Mulde Event (Biebesheimer et al., 2021).
Tie point set (1) marks a positive gamma-ray inflexion corresponding to the base of the Silurian (Erlström et al., 2022; Erlström & Sopher, 2019; Sopher et al., 2016). Set (2) aligns with a negative inflexion linked to the S2–S3 sequence boundary in the Baltic Basin and roughly coincides with the onset of the Ireviken Event (see Figure 2) (Erlström et al., 2022; Hartke et al., 2021; Lazauskiene et al., 2003). Set (3) corresponds to a gamma-ray trough at the base of the Mulde Event (see Figure 2 and SI.2.) (Calner et al., 2006; Erlström et al., 2022). Despite differing log expressions, this tie point could be identified in both the Altajme and Grötlingbo-1 wells, aided by the observation of the Mulde δ13Ccarb excursion in both records (see SI.2) (Calner et al., 2006). Set (4) is a positive gamma-ray inflexion that marks the approximate termination of the Mulde Event, which again could be identified with the help of the records from the Altajme and the more distal Grötlingbo-1 wells/cores (Calner et al., 2006). Set (5) is a minor gamma-ray peak traceable across most wells (see Figure 2). Set (6) is a negative inflexion in the gamma-ray log, which marks the boundary between the Hemse Group and Eke Formation (Eriksson & Calner, 2008; Erlström et al., 2022).
Due to the regional dip and erosion, increasingly thicker intervals of younger Silurian strata are missing toward the northwest of Gotland (see Geological setting). As a result, one or more stratigraphic tie-points may be absent in that direction. The missing tie points prevent stretching to a common depth scale. In such cases, missing intervals were filled using a median curve derived from the complete well logs.
Once the tie-points were defined and the data were pre-stretched, we applied the Dynamic Time Warping with Barycenter Averaging (DBA) algorithm (Holder, 2023; Petitjean et al., 2011; Sardá-Espinosa, 2019). The Dynamic Time Warping (DTW) part of the algorithm was performed using the basic DTW algorithm with L2 normalisation and a symmetric step pattern (symmetric2) (Giorgino, 2009). The alignment was computed within a moving window of 200 data points, with distance values square-root transformed before analysis. Backtracking was enabled to reconstruct the optimal warping path, and both open-begin and open-end settings were activated to allow flexible alignment at the start and end of the records. The DBA algorithm iteratively aligns all well-log pairs using Dynamic Time Warping. It computes their average trajectory within the DTW space rather than along the original depth or time domain. Unlike a simple arithmetic mean, which assumes uniform scaling across records, DBA calculates a barycenter, a central curve that minimises the overall DTW distance to all input series (Holder, 2023; Petitjean et al., 2011; Sardá-Espinosa, 2019). This is achieved through repeated cycles of alignment and averaging, during which each log is warped toward the evolving barycenter, and the barycenter is updated to the mean of the aligned sequences.
The DBA process reduces the influence of outlier logs or local anomalies while preserving regionally consistent stratigraphic patterns. The resulting barycentric curve represents an optimised, consensus-based gamma-ray reference profile that captures the most stable and correlateable lithological features across the entire set of well-logs. By averaging in the DTW space, DBA yields a more geologically meaningful composite curve than conventional stacking or depth-normalised averaging, particularly in successions where sedimentation rates and compaction histories vary among wells.
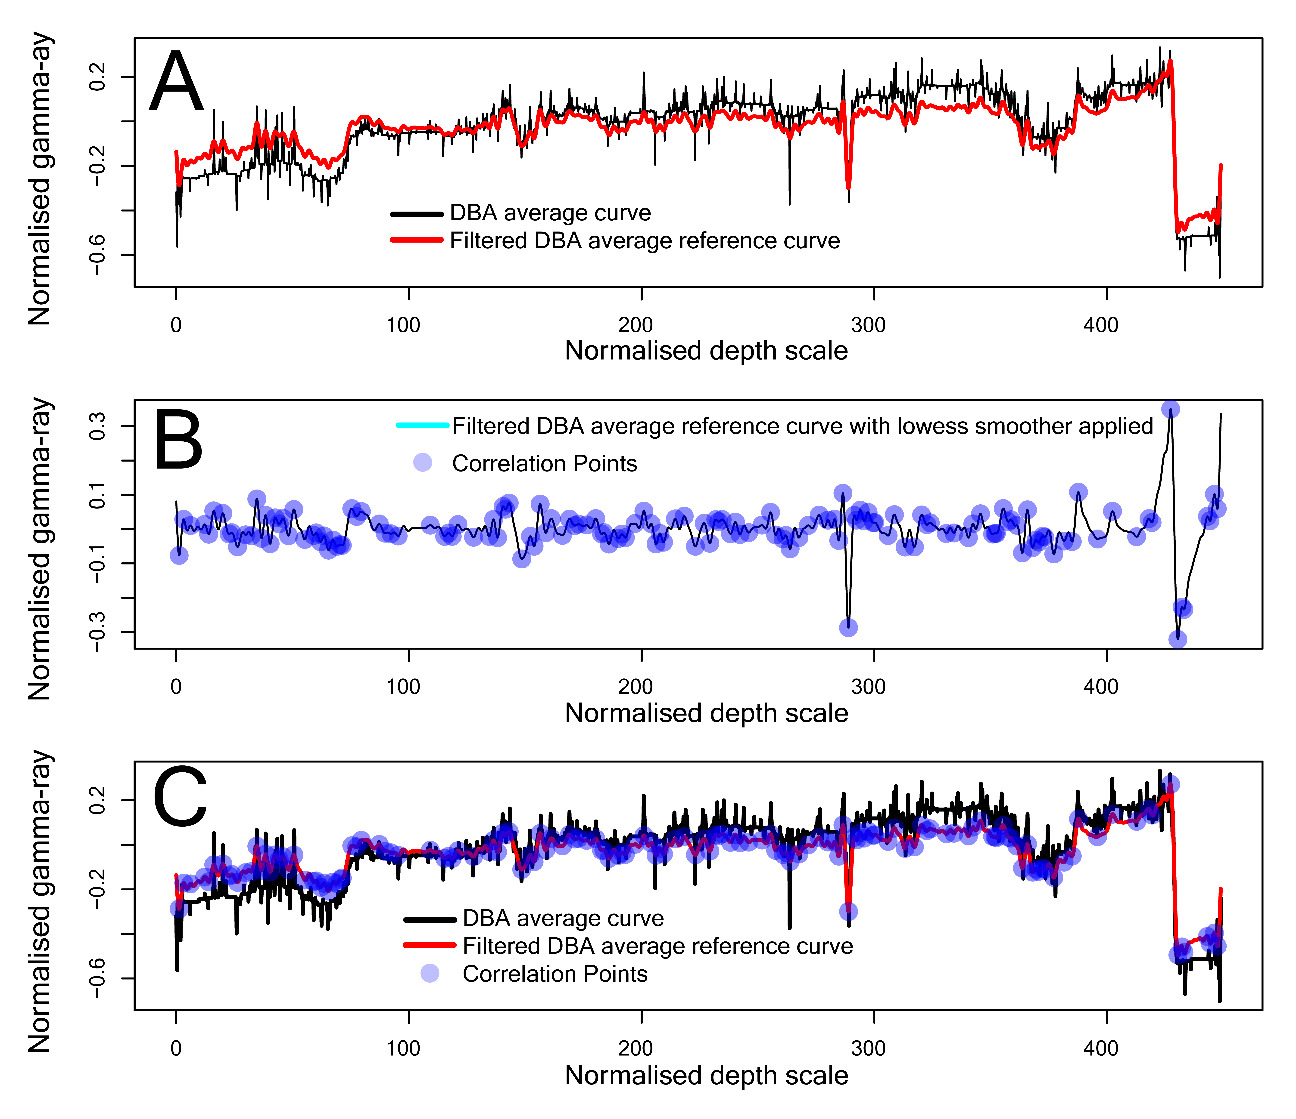
Like with most DTW-based alignment techniques, the DBA process can introduce blocky or spiky artefacts due to its tendency to over-sample flat regions. These artefacts were removed using a Taner bandpass filter, followed by a LOWESS regression to preserve local extremes while removing broader trends (Meyers, 2019). From the resulting smoothed and detrended reference curve, the 150 largest-amplitude peaks were selected as regional correlation points. The number itself is not arbitrary, since it corresponds to the maximum number of distinct, geologically meaningful peaks identifiable in the reference curve.
The DTW algorithm was then applied between the reference curve and each of the thirty-eight (pre-stretched) well logs, allowing the regional tie points to be transposed onto the individual logs. These tie points serve as the basis for the drawing of correlation lines across all wells, supporting a detailed subsurface interpretation.

RESULTS
The DBA algorithm produced a regional gamma-ray reference curve based on the thirty-eight gamma-ray logs (Figure 3A), which was then denoised and detrended (Figures 3A and B). From the detrended curve, a hundred and fifty data points with the largest deviations from the mean trendline were identified as key tie-points for basin-scale correlation (Figures 3B and C).
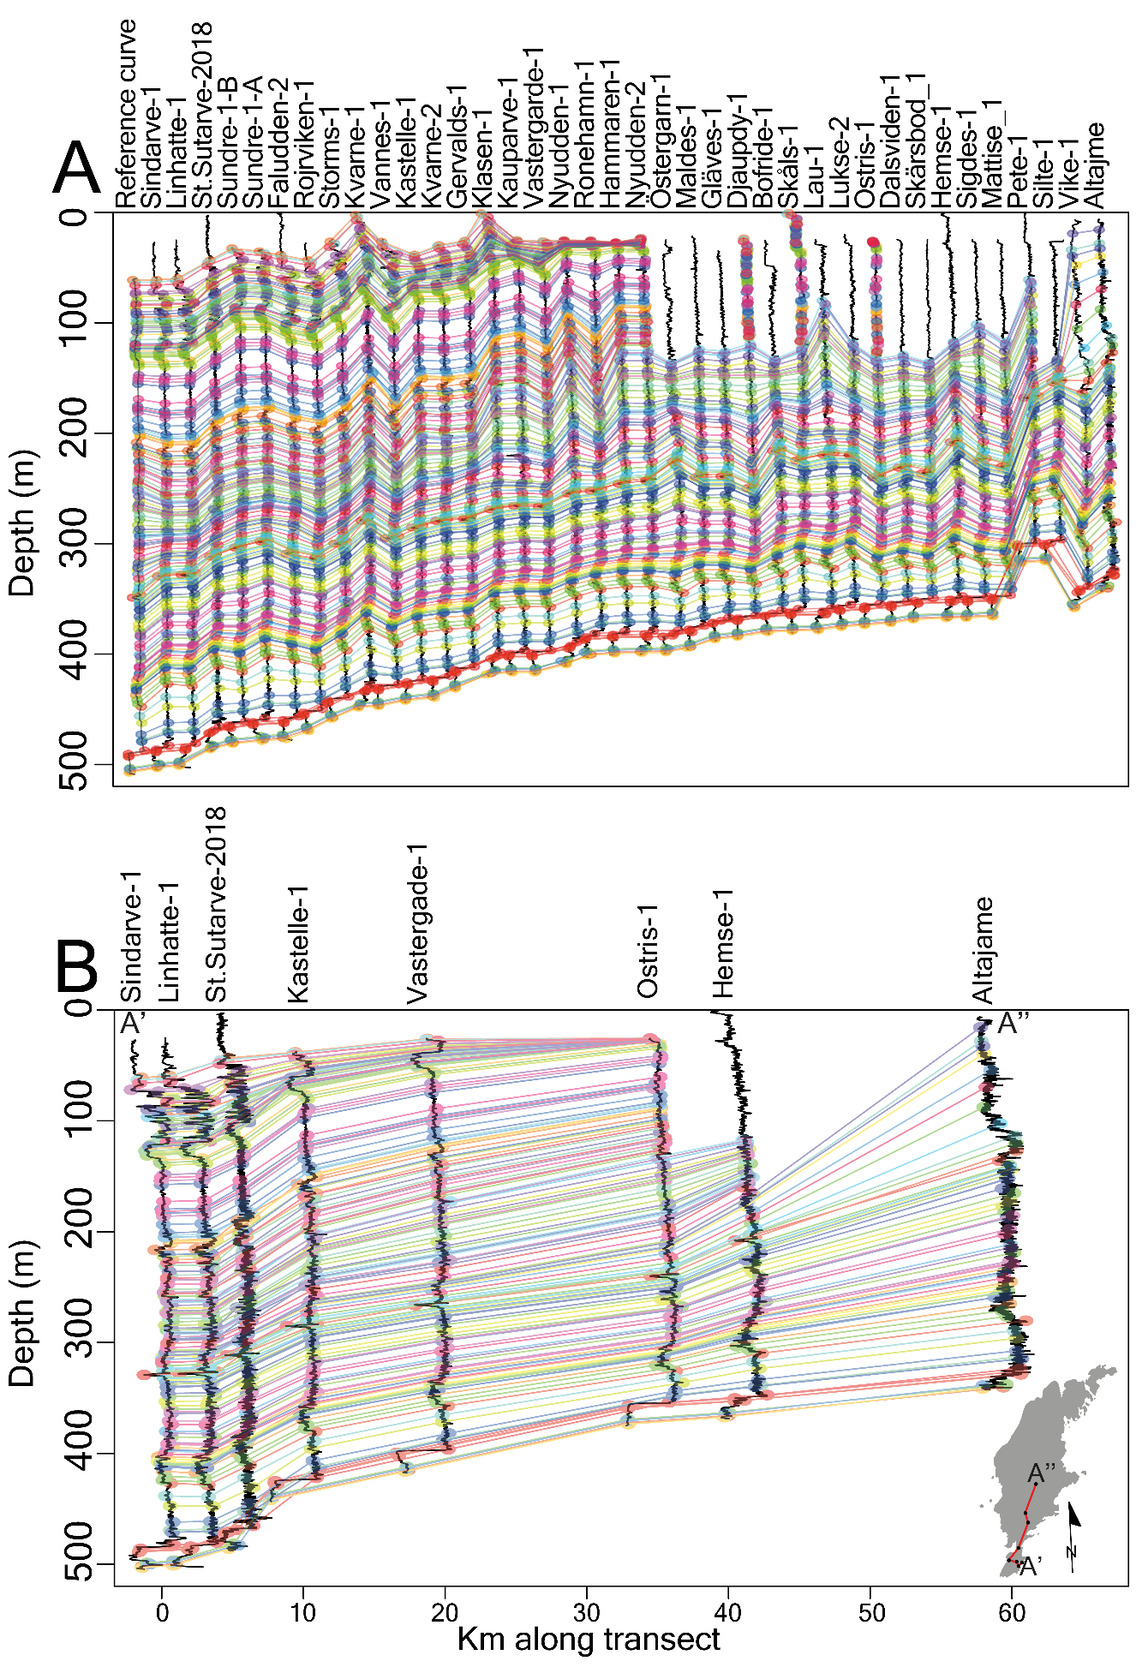
Each of the thirty-eight gamma-ray logs was aligned to the reference curve using DTW, enabling the hundred and fifty tie-points to be transposed into individual well logs (see Figure 4). This allowed for the automatic generation of correlation lines between corresponding tie-points (Figure 4A and B). It also allowed the construction of a cross-section along a ~60 km transect from the Sindarve-1 well to the Altajme core/well (Figure 4B). The correlated transect spans depositional settings from shallowest reefal (Altajme) to the deepest marine environment (Sindarve-1), offering a detailed view of lateral stratigraphic variations within the Silurian succession of Gotland.
DISCUSSION
On the use of the DBA-based workflow for well-log correlations
This study introduces a comprehensive and reproducible workflow for DTW/DBA-based well-log correlation, implemented in the R programming language (see S.I.3). It advances existing DTW based approaches by combing two key innovations: (1), the incorporation of relative stratigraphic depth (re)scaling before DTW alignment, and (2) the iterative construction of a (regional) reference curve using Dynamic Time Warping with Barycenter Averaging (DBA).
The (re)scaling step, which integrates geological expertise directly into the model, ensures that stratigraphic features known to correlate are aligned, even when they differ between well logs. Pre-stretching enhances the consistency of feature matching, improving both correlation accuracy and geological coherence. Correlation quality was assessed based on the continuity of characteristic log motifs and the preservation of stratigraphic relationships documented in the literature.
A total of six tie points were selected to achieve an optimal balance between geological guidance and algorithmic flexibility: fewer points led to correlations inconsistent with the established regional framework, whereas additional tie points risked over-constraining the DTW alignment and introducing interpretative bias. This limited set provided sufficient structure to maintain geological coherence without imposing excessive manual control, guiding the DBA algorithm in constructing a representative reference curve for the regional stratigraphy.
The manually defined tie points used to stretch the data in between the tie points acted as soft constraints rather than fixed anchors, providing broad stratigraphic guidance since the implemented workflow allowed DTW runs within the DBA modelling to redraw correlation paths based on signal similarity, thereby maintaining a balance between geological interpretation and objective, data-driven alignment. This approach is particularly effective in intervals where the confidence in the tie-points is uncertain rather than absolute.
By incorporating the DBA algorithm into the workflow, we overcame a key limitation of relying solely on DTW for stratigraphic correlation. Standard DTW runs often produce correlation paths that diverge and fail to realign when traced through a network of wells (Sylvester, 2023). A common workaround involves correlating all wells to a single reference log (Hagen et al., 2020; Hagen & Creveling, 2024; Hay et al., 2019; Wu et al., 2018), which can introduce systematic bias since any inaccuracies in the reference are propagated throughout the correlation framework. Using DBA to generate the reference curve is beneficial since the algorithm provides a data-driven solution by iteratively averaging multiple well logs to construct a regional reference curve that captures shared stratigraphic patterns while suppressing local noise and measurement errors. As more records contribute to the averaged reference, the alignment improves progressively, producing a more geologically representative and internally consistent correlation framework. This collective alignment approach reduces the influence of local anomalies and enhances the robustness of the final reference curve-based correlation framework.
Still, the workflow is not optimal since the underlying DTW algorithm, as used and implemented in the dtwclust package (Sardá-Espinosa, 2019), was originally designed for time-series clustering rather than stratigraphic data. As a result, it lacks some of the geological refinements such as explicit controls on temporal overlap and relative accumulation rate (Hagen et al., 2020, 2024; Hagen & Creveling, 2024; Hay et al., 2019). Future developments that integrate these stratigraphic constraints directly into the DTW algorithm could further enhance the accuracy, interpretability, and geological realism of DBA-based correlation frameworks.
It should be emphasised that the successful generation of a regional reference curve using the DBA algorithm was possible by the relatively high degree of similarity among the well logs, reflecting the basin’s “layer cake” stratigraphy. Nonetheless, careful pre-processing by means of the introduction of the tie-points was still essential, given the range of depositional environments represented in the dataset, from lagoonal and reefal facies to deeper basinal settings (Biebesheimer et al., 2021; Erlström et al., 2022; Hartke et al., 2021; Jorgensen et al., 2018; Samtleben et al., 2000). Although effective in this study, the use of a regional reference curve has its limitations, as such other DTW-based methods may be more appropriate in basins with significant lateral variability, such as those with meander belts, large prograding clinoforms, or turbidite deposits (Nieminski et al., 2024; Sylvester, 2023).
The correlation lines in this study show strong geological coherence, but some imperfections remain. For example, the upper bundle of correlation lines between 0 and 140 m in the Sindarve-1 well converges into a single point at the Ostris-1 well (see Figure 4). The convergence of correlation lines does not accurately reflect the geology of Gotland, which has a dip of (0.2-0.4) degrees towards the South (East), so near-surface correlation lines should end at the surface (Dahlqvist et al., 2015; Erlström et al., 2022).
In summary, the combined pre-stretching and DBA-based reference curve workflow provides a rapid, robust approach for generating geologically consistent correlation lines across a basin. This study underscores the value of integrating independent stratigraphic information into DTW-based correlations, effectively merging traditional stratigraphic expertise with modern, data-driven techniques. Nevertheless, the resulting correlations should always be evaluated against established geological knowledge and adjusted where necessary to ensure an accurate and coherent interpretation of the basin’s stratigraphy.
Subsurface stratigraphy and correlations in Gotland
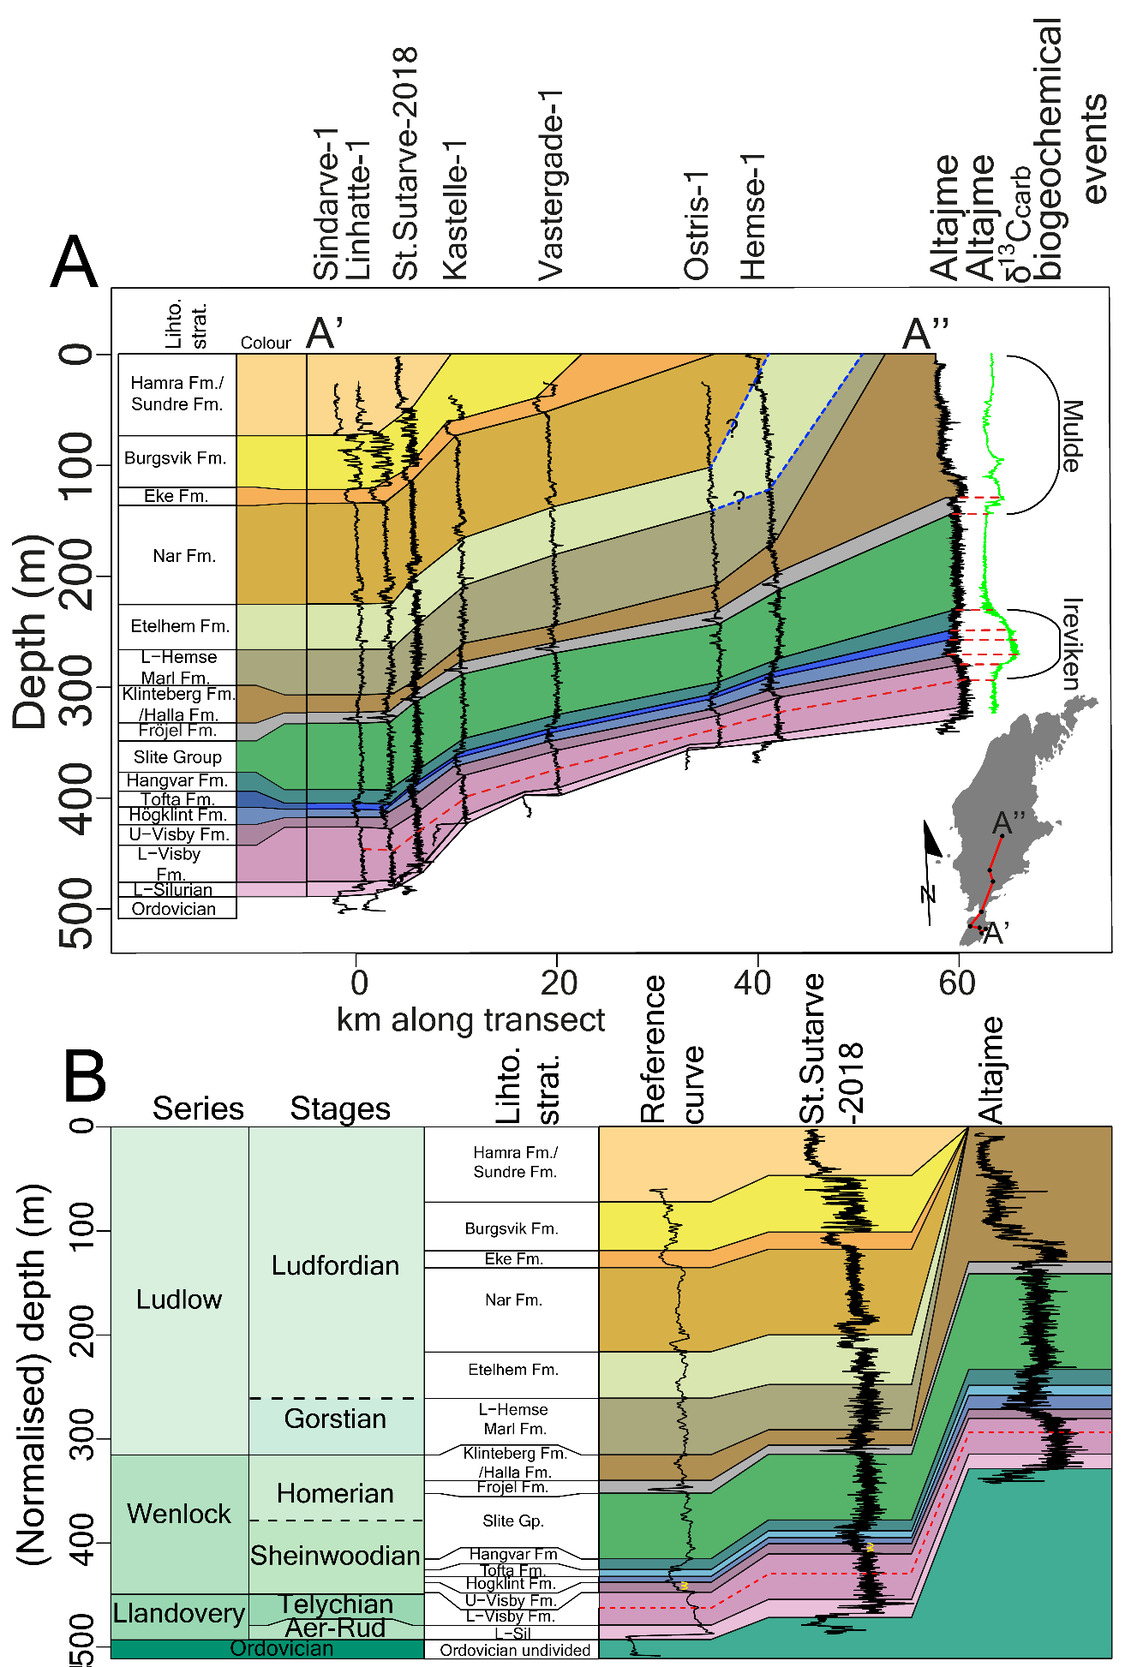
The DBA-derived correlation lines enabled the subdivision of Gotland’s subsurface succession into fifteen units (see Figure 5), further refining the ten subdivisions previously proposed by Erlström et al. (2022) for Gotland’s subsurface. The fifteen intervals are correlated to previously established surface and shallow subsurface units on Gotland (Biebesheimer et al., 2021; Calner, Jeppsson, et al., 2004; Calner & Eriksson, 2006b; Eriksson & Calner, 2008; Erlström et al., 2022; Hartke et al., 2021; Stolfus et al., 2023). Unit names reference surface equivalent formations for convenience but do not imply formal naming or redefinition of the subsurface stratigraphy. Some uncertainty remains, especially for deeper units such as the Fröjel Formation and older units, which lack explicit surface correlations in the studied boreholes. Consequently, the stratigraphic naming convention used in this study should be viewed as tentative.
The stratigraphically lowest and oldest Silurian unit identified in this study is not exposed at the surface. This unit has to date been identified only in the Grötlingbo-1 well/core, based on an integrated biostratigraphic study indicating the presence of a Rhuddanian to Aeronian-aged unit, separated by a gap spanning the late Aeronian to early Telychian (Männik et al., 2015). The lower Silurian unit is typified by higher gamma-ray values than the overlying Lower Visby Formation. A sharp rise in gamma-ray intensity marks the base of the lower Silurian unit. Variations in thickness and gamma-ray response within this unit create uncertainty about consistently assigning it to a specific stage or biostratigraphic interval across the study area. Further research is needed to clarify its stratigraphic affinity.
The base of the Lower Visby Formation coincides with a transition from the high gamma-ray values of the lower Silurian unit to the stable and moderately high gamma-ray values of the Lower Visby Formation. The top of the Lower Visby is marked by a peak in the gamma-ray log. This peak is preceded by a smaller peak in the gamma-ray log, which marks the onset of a minor rise in the δ¹³Ccarb curve, associated with the Ireviken Event (see Figure 5A). The smaller gamma-ray peak likely represents the onset of a period of enhanced primary productivity before the Ireviken Extinction Event (Hartke et al., 2021; Stolfus et al., 2023; Vandenbroucke et al., 2013). The smaller gamma-ray peak below the Lower to Upper Visby Formation boundary can be easily traced across the different well logs, confirming its utility for stratigraphic correlation. The base of the Lower Visby Formation coincides with a transition from the high gamma-ray values of the lower Silurian unit to the stable and moderately high gamma-ray values of the Lower Visby Formation.
The Upper Visby Formation corresponds to an interval of rising δ¹³Ccarb values and a steady decrease in gamma-ray log values (Figure 5). In the well logs spanning the transect between the Sindarve-1 and Vastergade-1 wells, two small but noticeable peaks are observed, superimposed on the declining trend in the gamma-ray log of the Upper Visby Formation (see Figure 5). These two peaks are absent in the shallower part of the basin that spans the Ostris-1, Hemse-1, and Altajme wells. The absence of these peaks suggests that part of the Upper Visby Formation is missing in the shallower parts of the basin, which is consistent with the unconformable nature observed for some of the boundaries between the Upper Visby Formation and the Högklint Formation (Cramer, 2009; Jeppsson et al., 2006; Manten, 1971). The variable gamma-ray response of this boundary necessitated manual tracking of the formation boundary, highlighting a limitation in the process that generated the DBA-based correlation lines.
The Högklint Formation is characterised by low gamma-ray values that increase gradually. In the Altajme Core, this unit is typified by numerous small, positive δ¹³Ccarb peaks (~1‰) that are superimposed on the larger peak. Sadly, the gamma-ray log lacks the resolution to resolve these finer-scale geochemical features. A distinct positive inflexion in the gamma-ray log marks the boundary with the overlying Tofta Formation. Stable, high δ¹³Ccarb values and low gamma-ray values typify the Tofta Formation. A positive gamma-ray inflexion marks its upper boundary with the Hangvar Formation.
The Hangvar Formation is characterised by numerous small negative δ¹³Ccarb peaks (~1‰) that are superimposed on a larger declining trend (Hartke et al., 2021). Unfortunately, the gamma-ray log lacks the resolution to describe the relationship between the log and these small δ¹³Ccarb peaks. In the Hangvar Formation, gamma-ray values first drop, then rise gradually. The transition to the Slite Group is marked by a shift toward more stable baseline gamma-ray values.
Consistently high gamma-ray values characterise the Slite Group and lack internal features suitable for further subdivision. A sharp negative inflexion in the gamma-ray log characterises its boundary with the overlying Fröjel Formation.
The Fröjel Formation exhibits a distinct gamma-ray trough followed by a sharp positive inflexion at its upper boundary, which coincides with a rise in δ13Ccarb values and the extinction interval of the Mulde Event (Hartke et al., 2021; Stolfus et al., 2023).
The Halla/Klinteberg formations are characterised by intermediate gamma-ray values forming a broad trough between the lower values of the Fröjel Formation and the higher values of the Slite Group. The Halla/Klinteberg formations lack clear internal markers, which prevents subdivision at the formation level. The Halla/Klinteberg formations correspond to the double δ13Ccarb peak of the Mulde Event (Biebesheimer et al., 2021; Calner, Jeppsson, et al., 2004; Radzevičius et al., 2014). The notably greater thickness of the Halla/Klinteberg formations in the Altajme and Vike-1 wells, compared to more southerly locations, reflects enhanced reef development during the Mulde Event (Biebesheimer et al., 2021; McLaughlin et al., 2019; Samtleben et al., 2000). The significant difference between the Altajme well/core and other records hinders the correlation of the δ13Ccarb peaks into the distal part of the basin. High-resolution δ13Ccarb profiles are therefore needed to better understand the relationship between gamma-ray log patterns and the carbon-isotope signal. Moreover, reefal influence in the Altajme core has altered the gamma-ray expression of the Halla/Klinteberg and possibly the Fröjel formations, making it unrepresentative of the more distal southern wells. Within the broader correlation framework, the gamma-ray motif of the St. Sutarve-2018 well is considered more representative for characterising the Halla/Klinteberg, Fröjel, and younger formations (see Figure 5).
A positive inflexion in the gamma-ray log values defines the boundary between the Klinteberg and the Hemse formations. On the surface, the boundary between the Klinteberg and the Hemse formations is defined by the lithological transition from reefal carbonates to marls. This transition is interpreted as diachronous, depending on the local depositional setting (Calner, Jeppsson, et al., 2004; Calner & Jeppsson, 2003; Flodén et al., 2001). In the subsurface, the thickness and well-log records of the underlying Halla/Klinteberg Formation do not change much in the transect between the Hemse-1 and Sindarve-1 wells, nor does the gamma-ray signature of the boundary itself change much (see Figure 5).
The Lower Hemse Marl Formation is marked by high and consistent gamma-ray values, with an increased variability at the boundary with the overlying formation (Etelhem formation). The shallower well-logs display an invariant gamma-ray log response (see Figures 4 and 5).
The Etelhem Formation is typified by high gamma-ray values, punctuated by irregular peaks and drops in the gamma-ray log. Surface studies associate the Linde Event with the lower part of the However, the absence of biostratigraphic and geochemical proxy data for this interval in the subsurface limits the ability to confidently identify the Linde Event.
A significant gamma-ray drop marks the base of the När Formation, potentially corresponding to the Millklint limestone unit (Calner, Jeppsson, et al., 2004; Jeppsson et al., 2006), though its exact stratigraphic position remains uncertain. The När Formation is generally characterised by stable gamma-ray values, aside from a distinct trough at its base. The Lau Event begins within the Botvide Member of the När Formation (Calner, Jeppsson, et al., 2004). No specific gamma-ray signature can be tied to the Botvide Member. The top of the När Formation is defined by a sharp negative inflexion in the gamma-ray log, marking the boundary with the overlying limestones of the Eke Formation.
The Eke Formation consists of algal limestones, exhibits low gamma-ray values, and encompasses the major rise and peak of the δ13Ccarb excursion of the Lau Event (Calner & Eriksson, 2006b; Erlström et al., 2022; Younes et al., 2017). A sharp increase in gamma-ray values marks the transition to the overlying Burgsvik Formation.
The Burgsvik Formation displays alternating low and high gamma-ray values, reflecting an alternation of siltstones and limestones (Calner & Eriksson, 2006b; Eriksson & Calner, 2008; Erlström et al., 2022). The Burgsvik Formation spans the upper part of the δ13Ccarb excursion of the Lau Event (Younes et al., 2017). A decrease in the gamma-ray values marks the boundary to the overlying Hamra/Sundre formations.
Low gamma-ray values mark the Hamra/Sundre formations. The formations coincide with a return to baseline δ13Ccarb values (Calner, Jeppsson, et al., 2004; Calner & Eriksson, 2006b; Eriksson & Calner, 2008; Erlström et al., 2022). Among the youngest units identified, the Hamra and Sundre formations were encountered in only a limited number of wells, limiting the ability to assess internal gamma-ray variability and making correlations less certain.
CONCLUSIONS
This study presents a comprehensive, reproducible workflow that integrates well-log data with DTW/DBA-based algorithms to perform stratigraphic correlation. The iterative construction of a regional reference curve using the DBA algorithm enabled consistent alignment across multiple well logs, highlighting the potential of DTW-based methods in improving correlations within relatively uniform successions.
The workflow was applied to a set of well logs spanning the Silurian succession of central and southern Gotland, enabling a semi-automated correlation that subdivided the subsurface into fifteen distinct geological units. Many of the identified subsurface units were successfully tied to their surface equivalents, though the quality of these correlations varied. Notably, the subdivision of the Hemse Group proved challenging due to significant uncertainties in its internal stratigraphy and boundaries.
The analysis effectively captured gamma-ray log responses associated with key biogeochemical events, including the Ireviken, Mulde, and Lau events, providing valuable insights into their subsurface expression and confirming their stratigraphic significance. In contrast, the Linde Event could not be identified in the gamma-ray data, emphasising the need for additional high-resolution δ13Ccarb records to refine its stratigraphic placement and improve interpretations of the surrounding units.
ACKNOWLEDGMENTS
The FNRS-PDR T.0051.19 grant financially supported Michiel Arts. Anne-Christine Da Silva acknowledges the “Conseil Universitaire de la recherche et la valorisation,”. Rohit Samant has been funded by the Deutsche Forschungsgemeinschaft (VL96/9-1, grant no. 527307807). We want to thank an anonymous reviewer for their comprehensive feedback, which greatly improved this manuscript. Mathias Sinnesael is thanked for his feedback on a preliminary edition of the manuscript. We further acknowledge the Workshop on Machine Learning Approaches for Automating Geological Correlation (November–December 2022), hosted by David De Vleeschouwer and Ewa Burwicz-Galerne at the MARUM Institute, Bremen, where the discussions provided the foundation for the ideas developed in this manuscript.